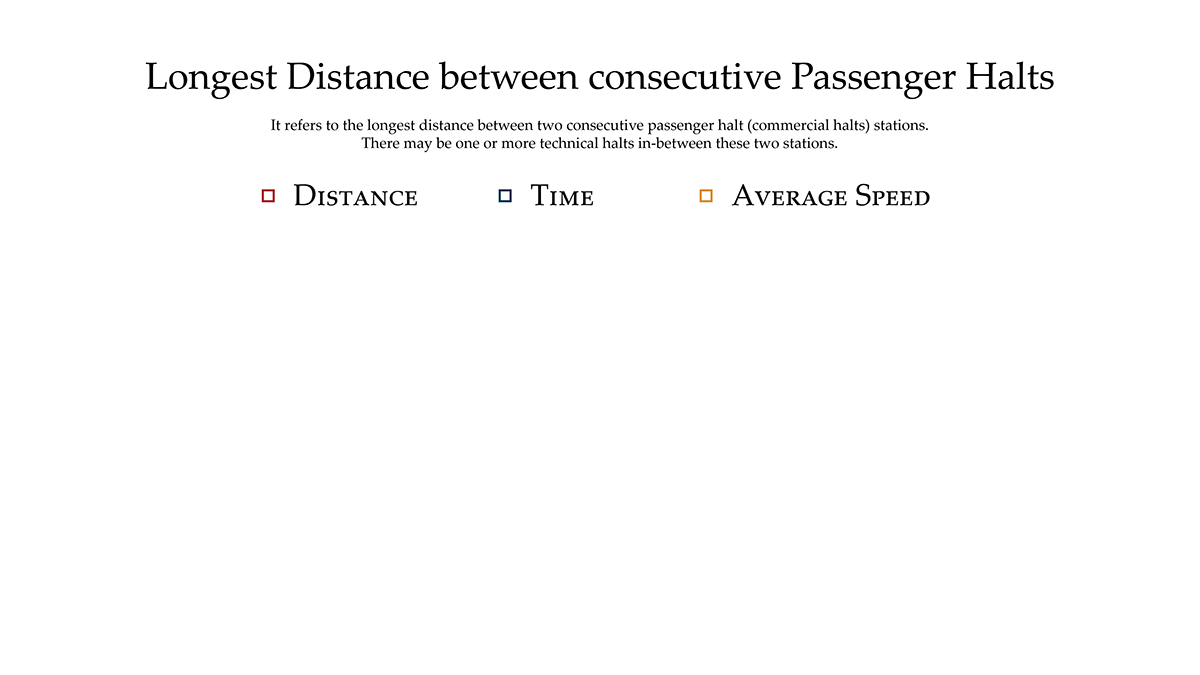
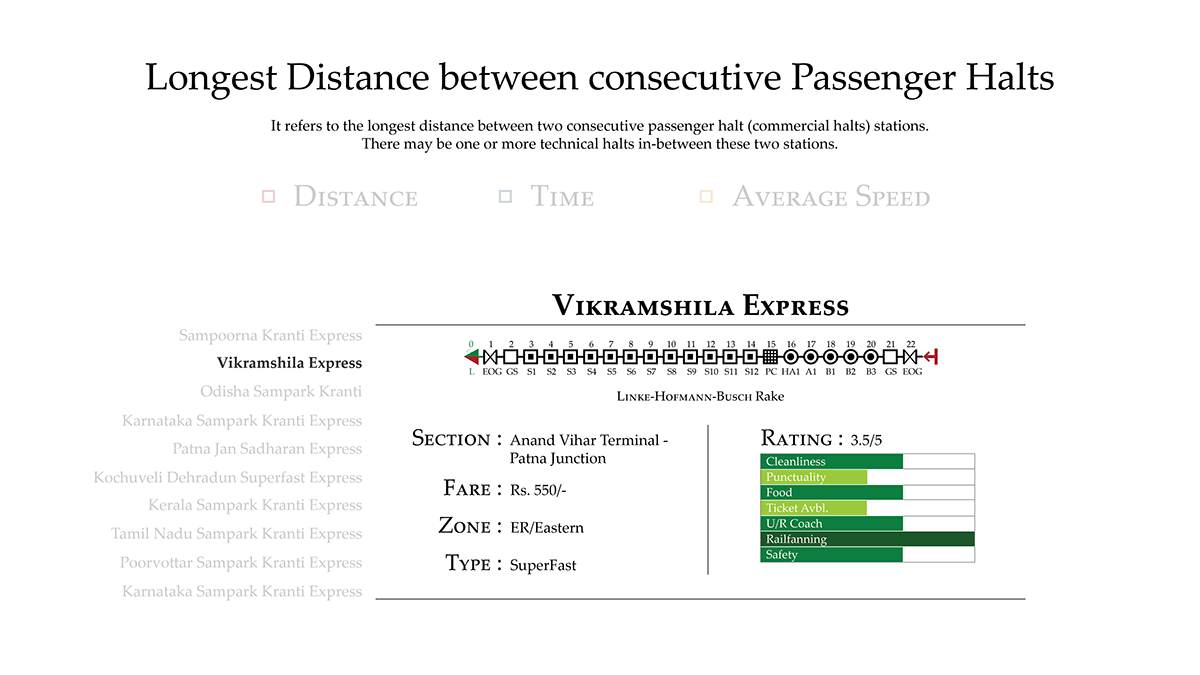
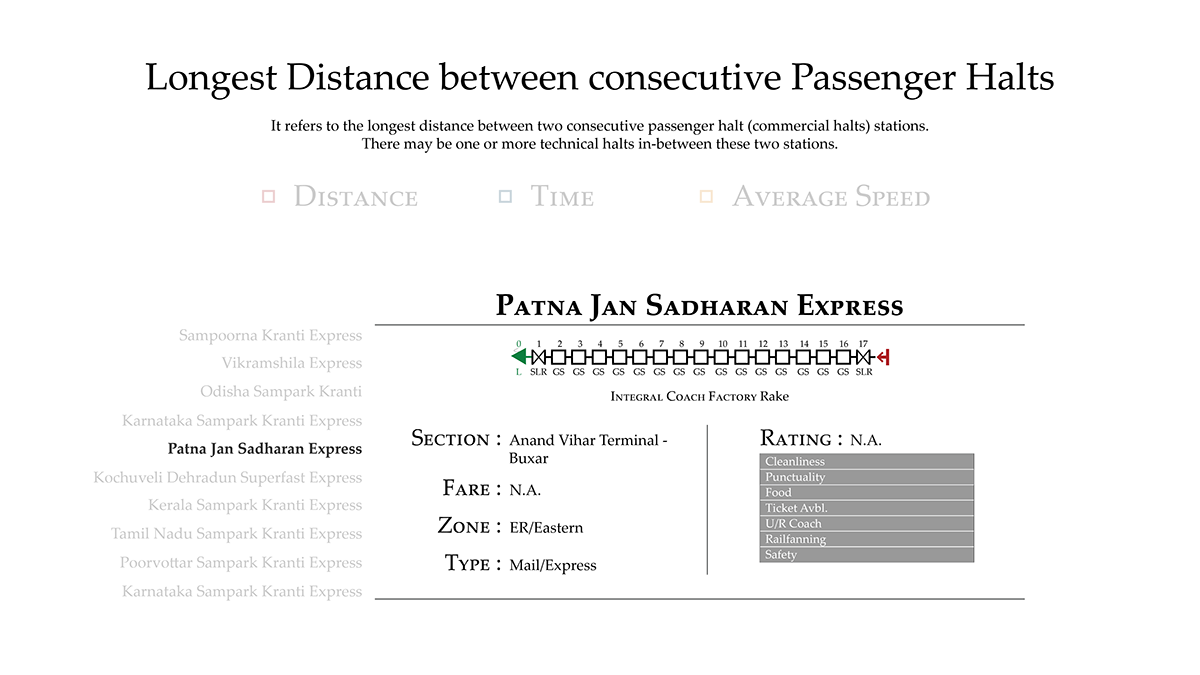
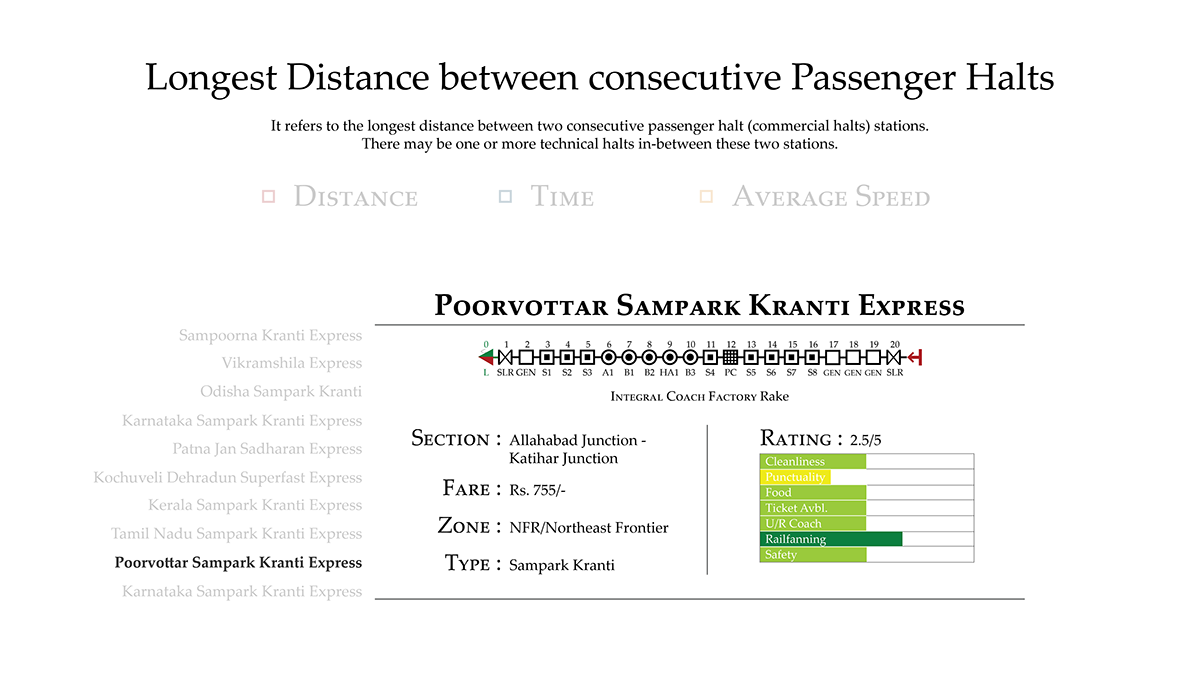
This infographic refers to the longest distance between two consecutive passenger halt (commercial halt) stations. There may be one or more technical halts in-between two stations. Hence it should not be treated as a non stop run. Here the infographic is created in the sequence of lengthiest and fastest run.
You can check out the full infographic over here.