Data visualization of trains connecting megacities of India
Click here to go to to original medium post where the article is published
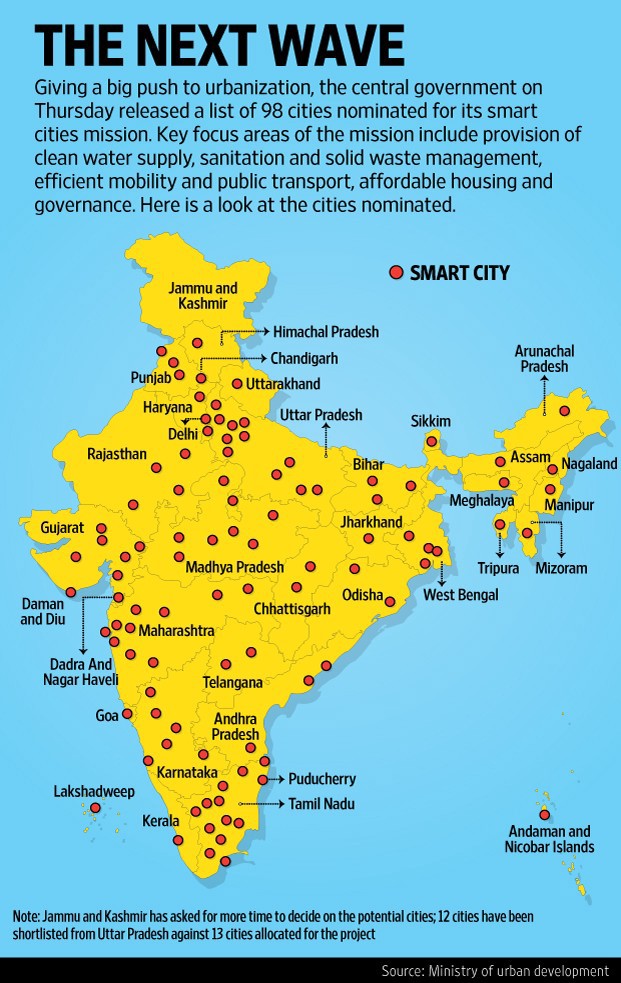
India has seen an unparalleled growth of urbanization in the last decade. Most of it was done as a part of ‘Smart City mission’, in which 98 cities and towns were foreseen to have a great potential, were to be converted into smart cities. These smart cities would be equipped with latest technological and innovative solutions which will help the citizens lead the way to future.
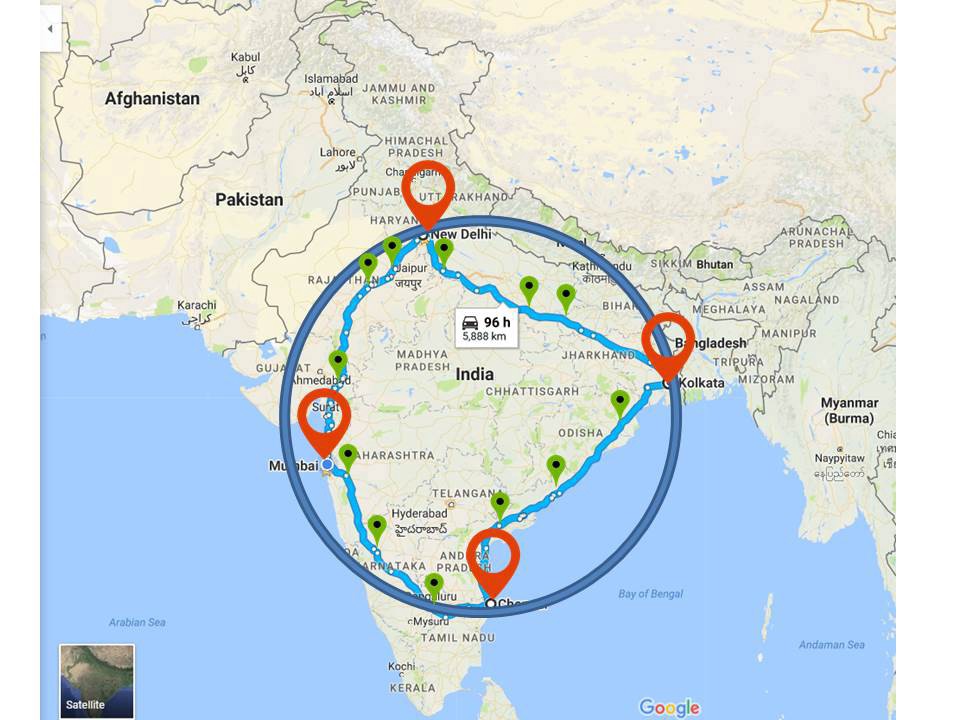
As we overview, the geographical context of India, we see the vertical and horizontal stretch of the country. The country has four state capital megacities.

Plotting megacities of India
These megacities are located in four corners of the country forming a quadrilateral.

Connecting the megacities
The transport authorities’ plans to connect these megacities. Recently, Elon Musk’s company Hyperloop has planned to set up the fastest public transport network throughout India. For details check their website — https://hyperloopindia.in/
Its a future project, but as of now in 2017, Indian citizens only rely upon the Indian Railways, as it is the cheapest means of transport over long distances.

Plotting the new upcoming smartcities dotting the paths connecting the megacities
These megacities will be connected along with the smaller smart cities, dotted on the connecting corridors.
Abstracting the quadilateral into a circular visual mapping
We can see from the diagram that, a circle could be a nice abstract form, to visualize the geolocations of these small and big cities.

Concept : Plotting according to the relative positions
We need to push all the dots out of the circle but still maintain their relative positions on the circle based on their actual geolocation .

Concept : Chord chart showing the flow from one megacity to the another
We can visualize the flow of data in a number of ways. But a chord diagram seems to be the best way in this case because visually it tells you a story of volumes flowing from to and fro different stations, and overall statistical data of each station.
For this project I scoped it only for the megacities leaving the smaller smart cities. But in future I would like to include them too in this visualization. So, we took Kolkata, Chennai, Mumbai and New Delhi and visualized the volumes of trains going to and fro.

Finding the number of trains departing from megacities to megacities in all days of week
I started with manually tabulating data from ‘irctc.co.in’ into an excel sheet (for easier tabulation). You are free to use any spreadsheet. In ‘irctc’ put the source and destination and choose all the days of a week one by one and tabulate it in spreadsheet. There will be zero number of train in the cell where source and destination is the same, because we are not visualizing intracity trains but intercity trains

Converting the data from spreadsheet to a matrix format for vizualization

Assign colors to cities for vizualization
The chord chart visualization
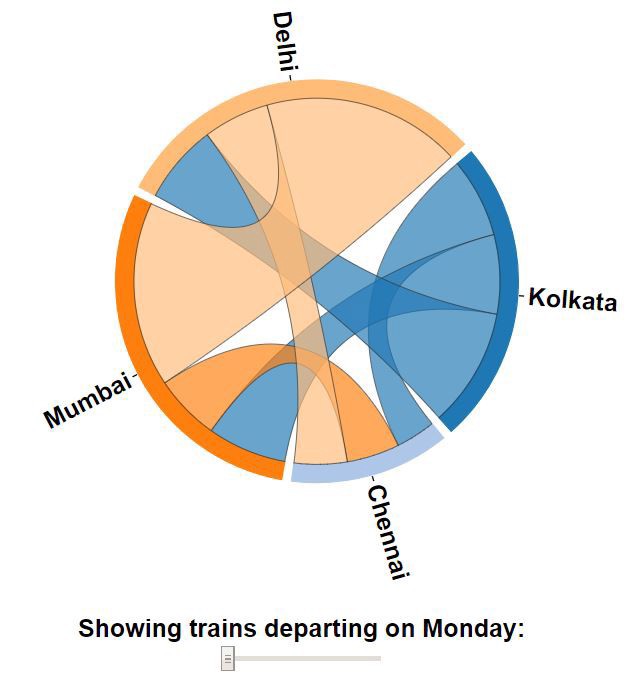
Click here to see the interactive version of the above chord data vizualization
Understanding the coding part
In a folder you need to make these four files:
chord.js — Deals with the vizualizing(draw circle,arcs,etc), composing(CSS), interaction(tooltip information,mouseover action,etc)
index.html — Embed different sections in a html webpage
matrix.json — Contain the database for visualizing in a matrix format
neighs.csv — Contain the color code assigned to cities
For ease of setup you can clone/fork/download my project to your drive and upload it in a web server (D3 doesn’t work in a offline mode).
Link to the project is here below
https://github.com/arkamajhi/arkamajhi.github.io
https://github.com/arkamajhi/arkamajhi.github.io
Please feel free to respond to this blog post or to me directly at any time with suggestions for this research project or with information about any interesting projects.
Hello Readers
I am Arka Majhi, a Masters student of Design discipline in IDC, IIT Bombay. I did an exercise on data visualization as a part of the academic work. This story is about visualizing the flow of trains across the megacities of India.
I am Arka Majhi, a Masters student of Design discipline in IDC, IIT Bombay. I did an exercise on data visualization as a part of the academic work. This story is about visualizing the flow of trains across the megacities of India.
Also check out my portfolio and repositories
Design Portfolio : https://www.behance.net/arkamajhi4d63
Architecture Portfolio : http://spadelhi.org/arkamajhi/
Support me by liking and posting your constructive comments about my projects. Thanks in advance. Will be waiting for your response.


