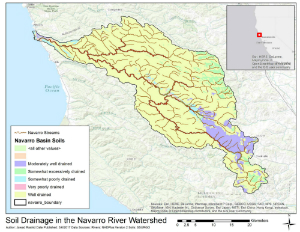
Soil Drainage in the Navarro River Watershed
In this project I was interested in analyzing river waterflow in California Navarro River watershed and visualize soil drainage for major and minor streams in this area using ArcGIS Pro. In this project we started off with map of USA, and rivers information about USA. We constrained the analysis for the Navarro River streams and used only rivers(flowlines) for the analysis. We identified major streams in the interested area and minor streams and visualized it in a meaningful way. Then we integrated soil drainage information for the same area and visualize soil drainage for the major and minor rivers. You can view the result of the analysis below. These are the steps i performed in order to get to the results:
- I started off with Rivers information NHDPlus(National Hyrdology Dataset) dataset. NHD contains complete features and information about rivers, water bodies, and watersheds for the entire United Stated.
- I was only interested in using the rivers(flowlines) for analysis so i choose to visualize only that section of the data.
- Next, as the data was for the whole USA I needed to constrain the analysis to Navarro rivers area of California and needed to discard irrelevant data to make the analysis efficient for the area I was interested to analyze.
- In order to constrain the area i imported Navarro boundary lines data into ArcGIS so I could constrain the analysis to my required area. Once i had the boundary data for Navarro area i used that to select the rivers from NHD data which intersected or were contained in Navarro area. This way I was able to discard all of data except the Navarro rivers which we were interested in analyzing.
- Next, I needed to make sure that the correct rivers were selected so I analyzed the selection of rivers and found out that the coast was selected where it was out of area of analysis. So i manually removed additional rivers which we were not interested in analyzing and saved the output rivers as a new dataset. This data is navarro streams dataset we will use for the rest of analysis.
- Next I needed to add a base map for further analysis so i used topographic base map for analysis setting up the correct Geographic Coordinate System and setting up the projected Coordinate System of WGS 1984 Web Mercator (auxiliary sphere) for projection as this projection is optimized for California area and the type of analysis I needed to perform.
- With the basemap and coordinate system set up I moved on to finding soil drainage in the interested rivers. I imported the Cummulative Area table which provided the total area of the rivers areas. This dataset contained total drainage per square kilometer in each area.
- Using the total drainage/sq km attribute i needed to find the area where the total drainage was greater than 50 square kilometers. With this new attribute for rivers with total drainage greater than 50 square kilometers i was able to select the major streams in terms of drainage as you can see the bold streams in the result below.
- With this information found I used buffer tool to find soils within 100 meters of major watersheds we identified in last step. With this buffer tool I was able to limit my analysis to soils within 100 meters of the major watersheds.
- With the area of analysis constrained i imported the Navarro soils data I acquired from SSURGO dataset. I used spatial join to get only the soil information for the buffered 100 meters areas we calculated close to major watersheds.
- With the last step I was able to get additional attributes along each major watershed which denoted the soil drainage near that area. With this information i was able to symbolize the map with color based on the soil drainage / square kilometer to be able to visualize which areas have more soil drainage and which have less.
- With the main analysis done I needed to present my findings. So i choose to go to Layout view of ArcGIS and start adding my results in a meaningful way plus additional components so viewers can understand the map.
- I choose to add title, mini maps of the area I analyzed, scale of the map, compass, data source, author information and legend so it is easier for anyone to understand what is happening the map and understand what each attribute or color on the map means.
- With the final touches like color changes for the map i came up the map below. I believe so that i was able to present my findings and answer my question effectively through the use of geo processing and map tools.


