ENFORMASYON TASARIMI, VERİ GÖRSELLEŞTİRME
VE İNFOGRAFİK KULLANIMI* (ÖZET)
Enformasyon, günümüz insanının hayatını devam ettirebilmesi için ulaşması, elde etmesi, kazanması, ayrıştırması, kullanılabilir hale getirmesi, doğrulaması veya kısacası sağlıklı bir şekilde sahip olması gereken ilk ve en büyük şeydir. İşte bu tezde bu ‘şey’in öncesi ve sonrasının ne olduğu, sağlıksız ve sağlıklı edinimi sonucunda neye dönüştüğünü bulmak amaçlanmıştır.
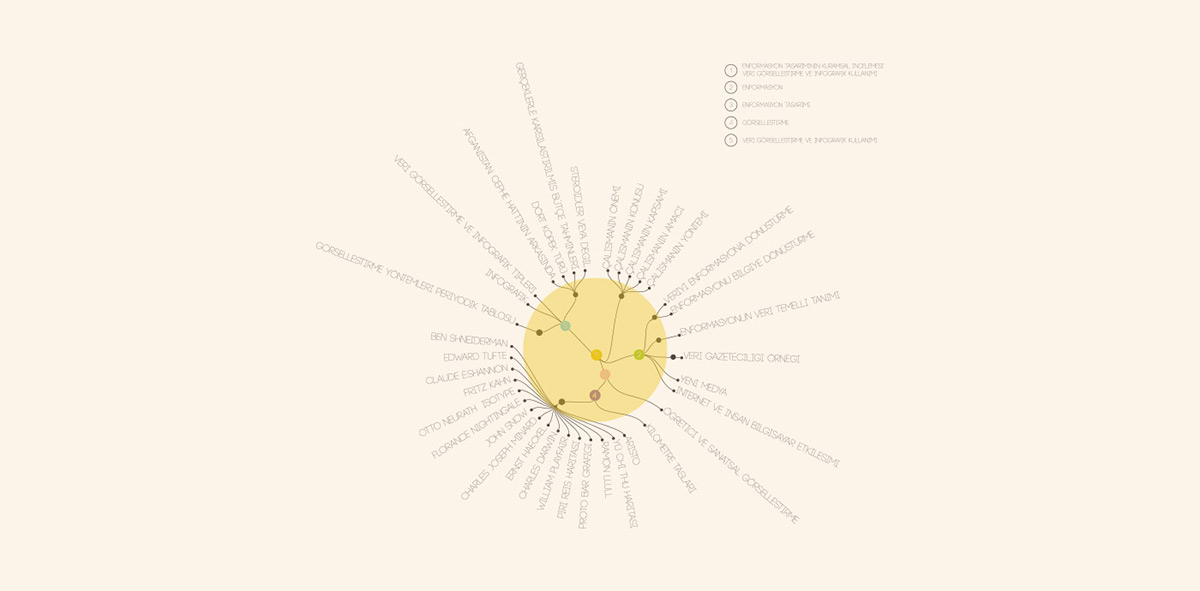
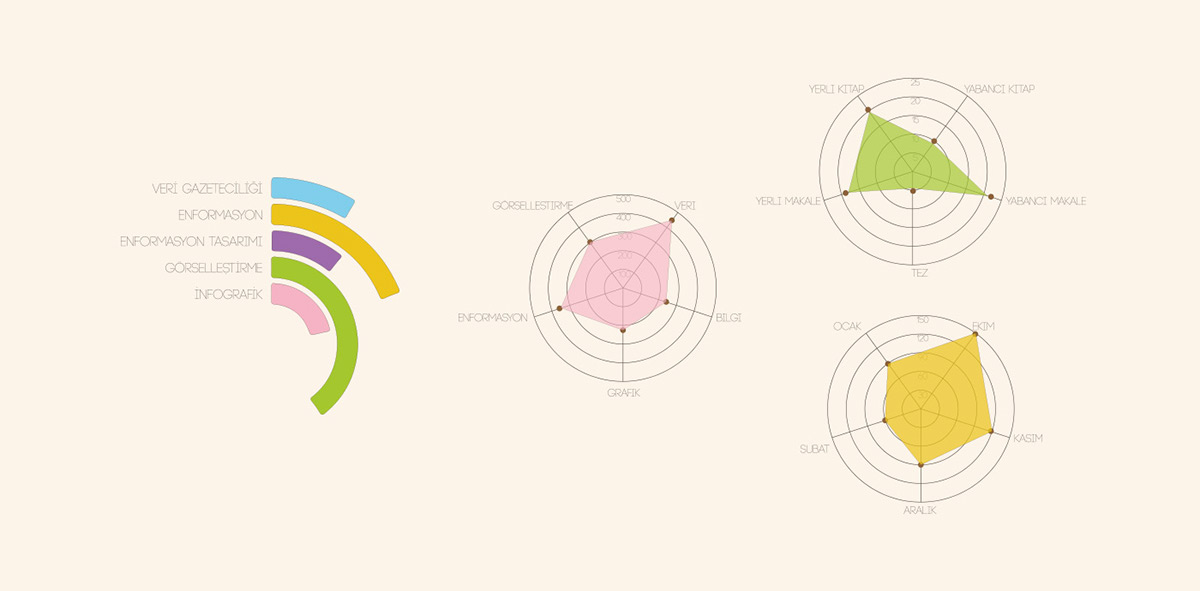
“Enformasyon Tasarımı, Veri Görselleştirme ve İnfografik Kullanımı” adlı bu tez kapsamında öncelikle enformasyonun ne olduğu ile ilgilenilmiş, günümüzdeki varlığını nasıl sürdürdüğü, ne tür anlamlar taşıdığı ve hangi mecralarda hangi anlamlarla var olduğu incelenmiştir. Enformasyon üzerine yapılacak tanımlamaların zorluklarına dikkat çekilen bu çalışmada kavramın ortak anlamına ulaşmak için evrensel düzeyde yapılmış en güncel yaklaşımlar bir araya getirilmiştir. İlk bölümde enformasyonun kuramsal incelenmesi yapıldığı gibi ikinci bölümde enformasyon tasarımına da kuramsal açıdan yaklaşılıp güncel tanımlamalara ulaşma amacı güdülmüştür. Bu açıdan veri gazeteciliği, yeni medya ile internet ve insan bilgisayar etkileşimi alanlarına da değinilmiştir. Yazılı dökümanların incelenmesi suretiyle veri toplama yöntemi tercih edilmiştir.
Sonuç olarak enformasyon tasarımının alt başlıkları sayılabilecek veri görselleştirme ve infografik konularına yer verildikten sonra enformasyon tasarımı ile görselleştirmenin ortak ve ayrı yönleri tespit edilmiştir. Veri görselleştirme ile infografiklerin benzerliği ve enformasyon tasarımında kapladıkları alan ve veri görselleştirme yöntemlerinin kullanıldıkları yerlerin iyi anlaşılması için ‘Görselleştirme Yöntemleri Periyodik Tablosu’ isimli çalışmanın önemi vurgulanmıştır. Araştırmacılara, eğitimcilere, tasarımcılara alanla ilgili çalışma yol ve yöntemler önerilmiştir.
INFORMATION DESIGN USE OF DATA VISUALIZATION
AND INFOGRAPHIC* (SUMMARY)
Information is the first and greatest thing to receive, obtain, acquire, decompose, make useful, confirm or briefly to have it in an healthy way for today's people to survive. So in this thesis it's searched what is the before and after of this "thing", what it becomes as a result of its healthy and unhealty acquirements.
In this thesis titled "Information Design, Use of Data Visualisation and infographic" firstly interested in what information is, examines how it maintains today, what kind of meanings it has and in which fields with which meanings it exists. This study draws attention to struggles of all definitions to be made on information and latest current approachs made in universal level gathered together to reach the common meaning of the concept. As theoretical analysis made in the first part, there is also a theoretical approach to information design in order to reach current definitions. In this regard the data journalism, new media and human-computer interaction fields have been referred. Data collection method by examining the written documents is preferred.
Eventually, data visualization and infographic which could be considered as subheadings of information design mentioned, common and seperate sides of information design and visualization indicated. The study titled "Periodic Table of Visualization Methods" is found worthy to be examined to make understand better the similarities of data visualization and infographics and the space they cover mentioned clear, the places where visualization methods are used. Working ways and methods are suggested to researchers, educators and designers.


* Selçuk Üniversitesi Sosyal Bilimler Enstitüsü Grafik ABD. Grafik BD. Yüksek Lisans Tezi
* Selcuk University Institute of Social Sciences Master's Thesis
Danışman: Doç.Dr.Harun Hilmi Polat


