


Some new abstract data designs I've been working on for past couple of months. Again was used Adobe Illustrator, After Effects, some 3d stuff and custom scripts for AI.
For older works I've created script for adding random numbers to points of interest on the graph. But there was no correlation between point size and number - so I fixed this issue.
Also all numbers were created in new layer above (AI), so all overlaps were not so good. Now numbers are placed just above related objects.
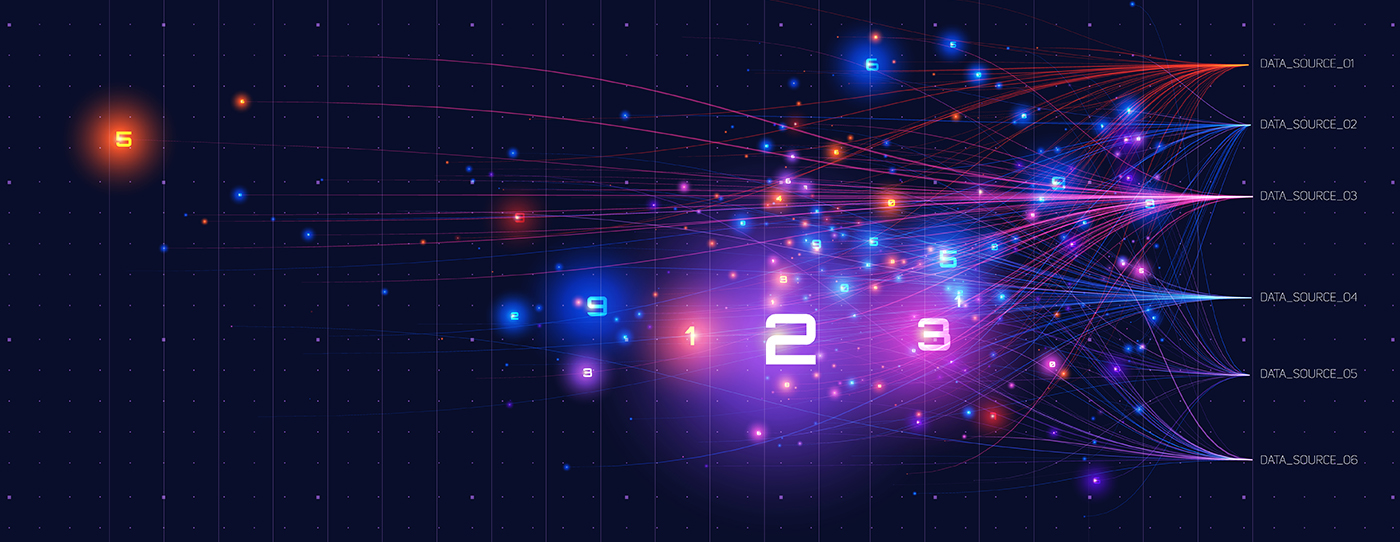


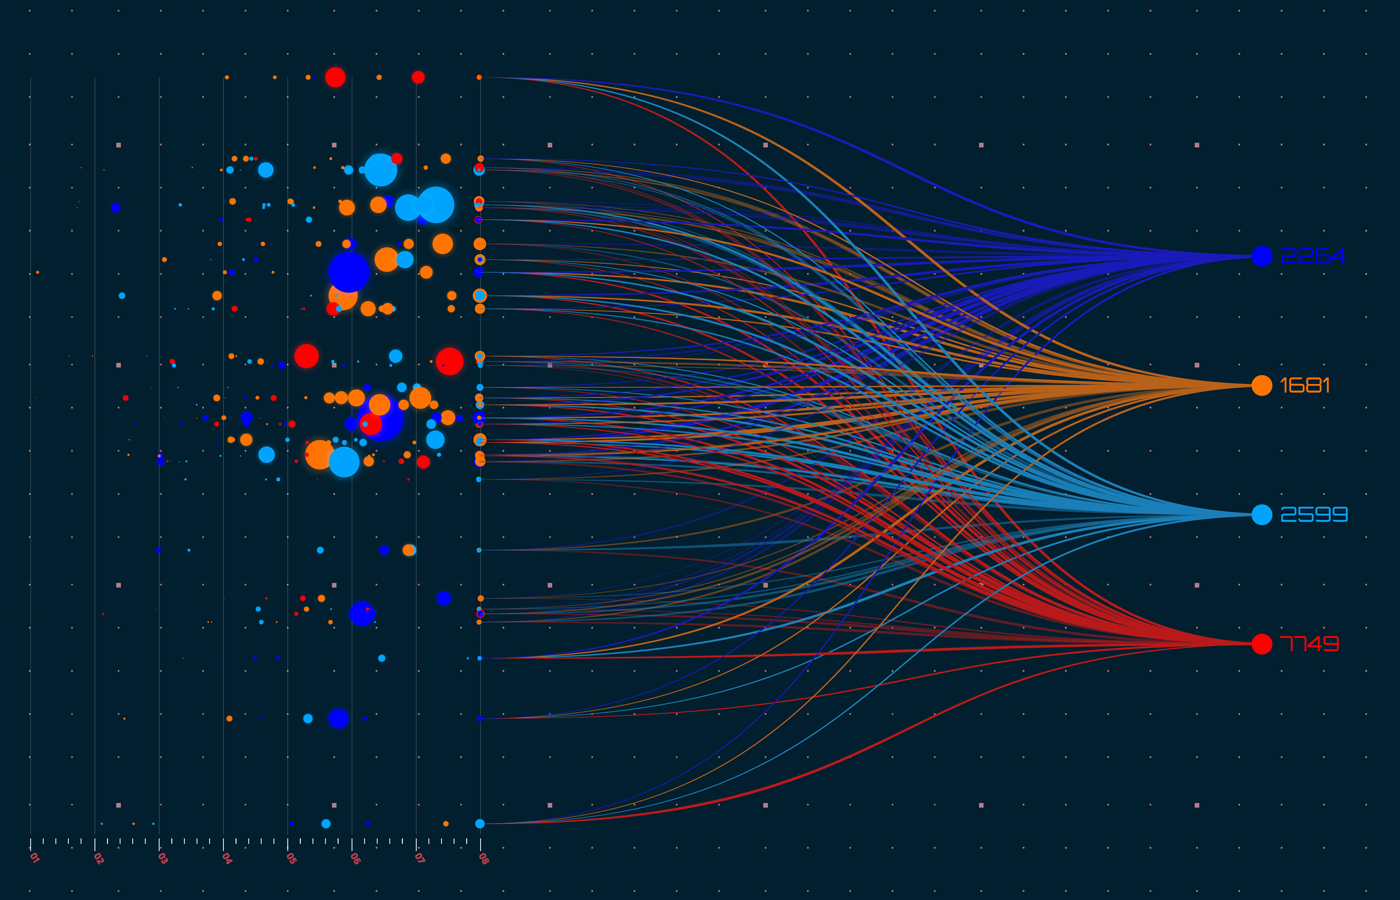


For creation of colorful trails in two last graphs below I also used script that transfrom stroke color to gradient and applies blending mode. Some posterization were applied to colors for creating only 100-200 gradients instead of thousands.


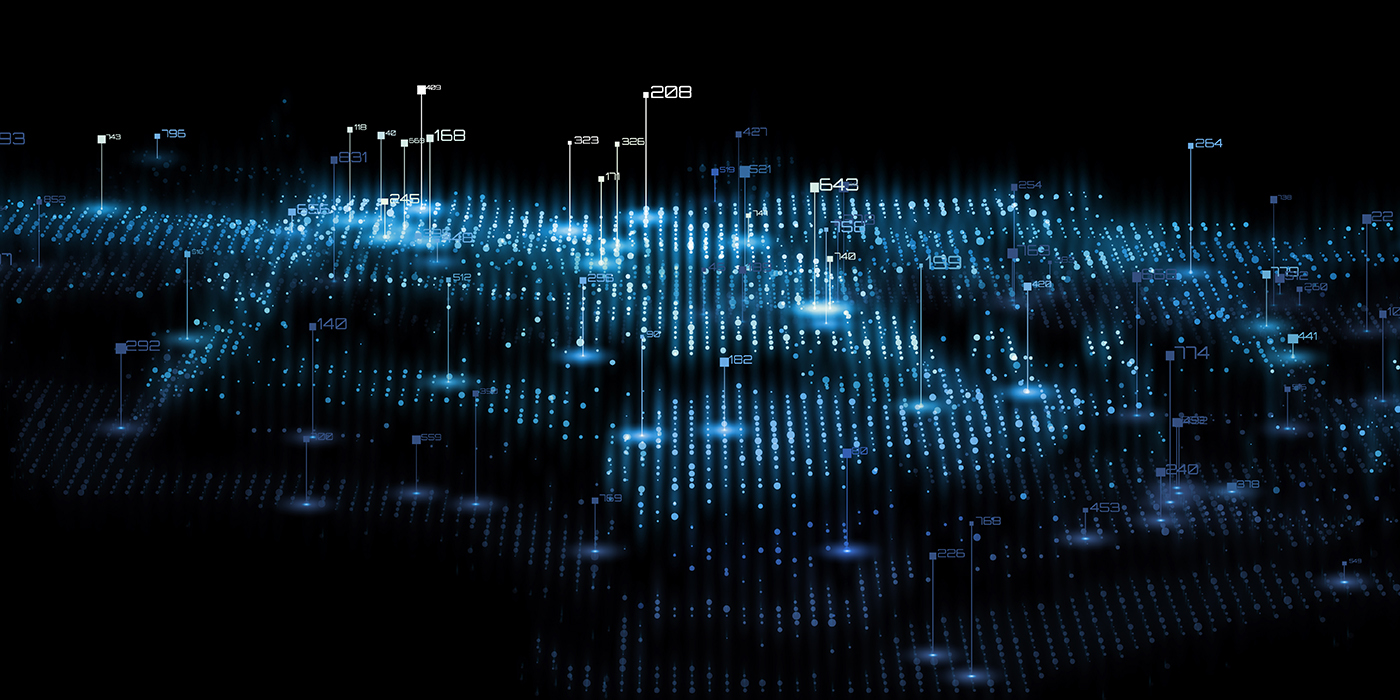
I've made some kind of bar graph script produce bars with height correlated to source object size. Below is map of world population density made with it.


If you need this stuff for your work, you can purchase this backgrounds here:
Shutterstock or CreativeMarket
Shutterstock or CreativeMarket
Thanks for viewing and appreciation!