


Bar Chart
Is one of the most common ways to visualize information, because its clear, and easy to understand.
Bar Charts are used to show categorized information, and the behavior of certain entities.
Bar Charts are cool when You are trying to compare data across long time periods and its easy to show important values.
Bar Charts are cool when You are trying to compare data across long time periods and its easy to show important values.
Bar Charts are cool when You are trying to compare data across long time periods and its easy to show important values.
Perfect Mix: Combine This with a Map Chart.
Nice To have: Highlight category and sortings.
SMART: Stack it!
Line Chart
Like the Bar Chart, is one of the most commons graphic displays. It's used to show data across the time and consists in the connection of points using a single line. This type of chart allows you to show trends, acceleration, and other value sequences.
Especially cool when you know a specific period, and the corresponding data related to that period.
Perfect Mix: Bar Charts.
Perfect Mix: Bar Charts.
SMART: Don’t show more than four line trends by Chart.
Shade it to create an area chart.
Shade it to create an area chart.
Pie Chart
If you have a small data set, Pie charts are the best choice. The less the number of slices is, The more impact and and ease of understanding the user get. Also, Pie charts, are the best option to show percentages and visual comparison. The main approach, is to show part-of-whole relations and proportions.
Perfect Mix: Map Charts.
Perfect Mix: Map Charts.
SMART: Don’t use more than 5-6 slices.
The sum should be always 100%.
The Order its very important!
The sum should be always 100%.
The Order its very important!

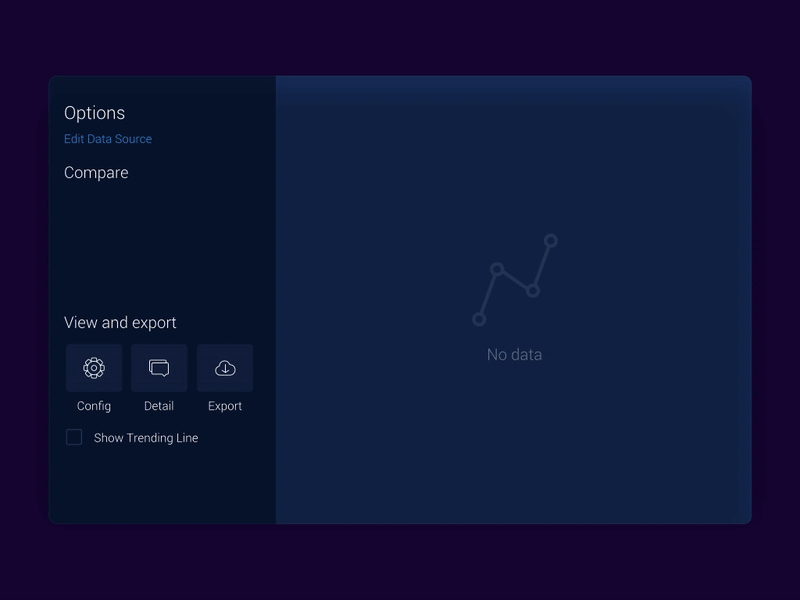
Scatter Plot
This type of chart allows you to show different pieces of information related.
Effective way to show trends and concentrations. It's really helpful to show the relationship of two items, for example amounts, increments, etc.
It's a very Important tool to helps you to focus in defined issues for future predictions and research
Effective way to show trends and concentrations. It's really helpful to show the relationship of two items, for example amounts, increments, etc.
It's a very Important tool to helps you to focus in defined issues for future predictions and research
SMART: Add filters, drill down into different levels of detail.
Add a trend line to the chart when correlation between data is defined.
Use shapes, color and more to tell a story.
Add a trend line to the chart when correlation between data is defined.
Use shapes, color and more to tell a story.
Gantt Chart
Gantt Charts shows the start and end for the projects or periods of time. Also allows you to be aware of deadlines and other issues related to project success and good communication
This type of charts are amazing for planning and schedule projects and provide people of key information of the work to be done and when.
Normally, it includes a list of activities, with the duration over time. It's really helpful in the estimation and the activities that need to be worked in parallel.
Construction: Rows: Activities & tasks.
Columns: Time period.
Columns: Time period.
Important: Show Who is responsible for the activities.
Add a description and progress
Add status colors
Add a description and progress
Add status colors
Show dependencies
Use when: You are working over deadlines
Delivery dates
Delivery dates

So... Which Chart is next...?
I hope You follow me across this project and discover some cool information together. I`'ll be uploading new interactions as soon as possible.
Check more animations on my Dribbble profile.
Share and comment if you like it!

Love is the best payment...


