Exchange 2014
In 2014 I did an exchange from Anglia Ruskin University to Avans Hogeschool, Breda, Netherlands to do a module called Visualizing Information for 5 months. Over the 5 months there were 4 projects to complete using 4 different methods of expressing information, A3 poster, Animation, 3D and digital interactive. Here is a short review of the projects.
The original submission for the module with more on each project can be seen on blogger on this link: http://visinf2014.blogspot.co.uk/search/label/Phil%20Gardner?max-results=20
The original submission for the module with more on each project can be seen on blogger on this link: http://visinf2014.blogspot.co.uk/search/label/Phil%20Gardner?max-results=20
One Billion A3 Poster
The concept of the project is to express one billion in a single A3 poster, taking you on a set by step journey that can help you comprehend how big one billion is. Here are some concept drawings and final posters showing how I got to the solution I did.
Further information can be found on the blogger post here:
http://visinf2014.blogspot.co.uk/2014/09/one-billion-ants-at-park.html
The rework was done as a revisited project a few months later and can be seen here:
http://visinf2014.blogspot.co.uk/2015/01/one-billion-ants-at-park-revisited.html
Further information can be found on the blogger post here:
http://visinf2014.blogspot.co.uk/2014/09/one-billion-ants-at-park.html
The rework was done as a revisited project a few months later and can be seen here:
http://visinf2014.blogspot.co.uk/2015/01/one-billion-ants-at-park-revisited.html

Concept drawings

Final idea concept drawings

Colour tests


Social Status Animation
This project was about social status, we had to research it and chose how we wished to express it then write a script, produce an animation and create the audio. I chose to do this in the style of a David Attenborough documentary, using the audio style of Planet Earth (2 years before they made Planet Earth 2). Taking the influence from the Up Series (7 Up, 14 Up, 21 Up ect.) I chose to use the school playground as a way to explore human social status and structure. Using images created by the children themselves rather than trying to express there personalities through my interpretations of them. The voice over is done by myself with the script made up from studies into playgrounds and reworded David Attenborough voice overs.
Further information can be found on the blogger post here:
http://visinf2014.blogspot.co.uk/2014/10/assignment-2-animation-about-status.html
Further information can be found on the blogger post here:
http://visinf2014.blogspot.co.uk/2014/10/assignment-2-animation-about-status.html
Area 3D Model
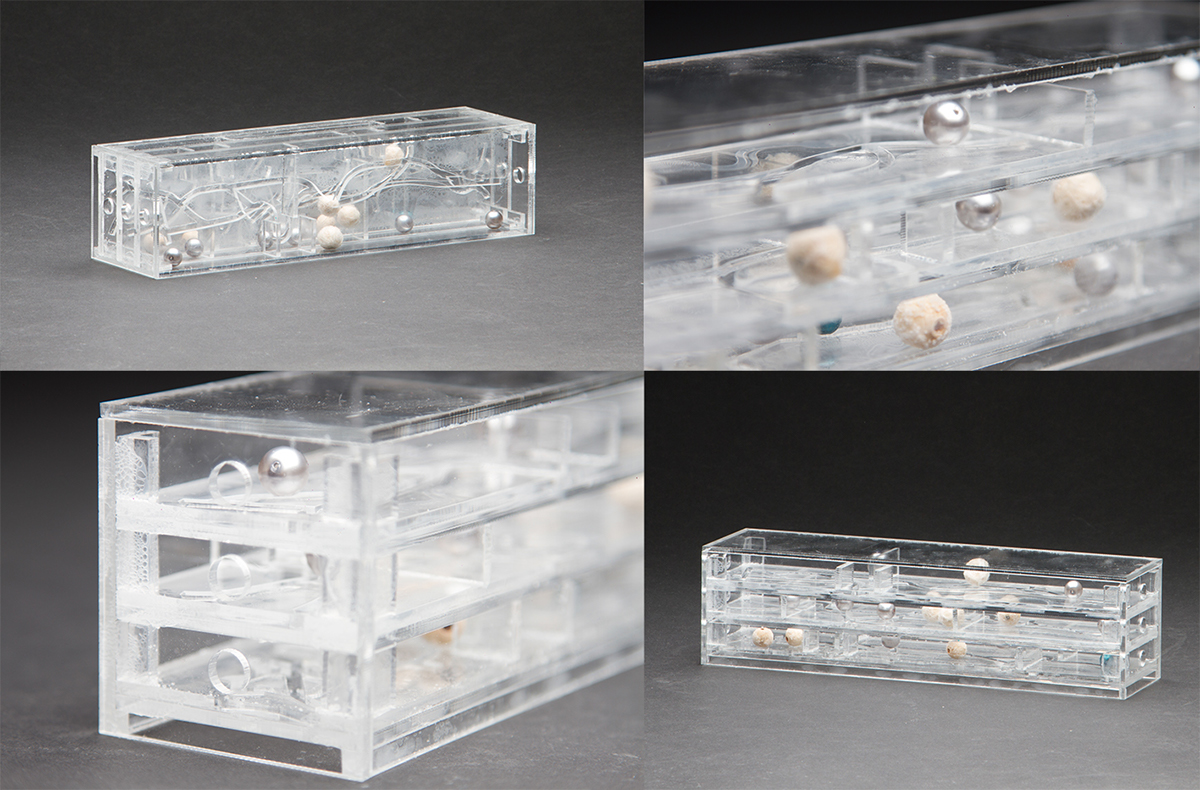
For this project we had to pick a 400 x 400 metre area, be that city, countryside, land or water, look into that area, discover data and express it in a 3D model. This was a group project and we chose the market square in the center of Breda, over the 4 weeks we looked into a lot of different ways to express the data and tried to find the most interesting data. In the end we felt something like a game would give the user a way to explore the information without feeling like it was a chore to uncover it. Here are a few images of the two mock-up models and the final model made out of acrylic and cut on a laser cutter.
Further information can be found on the blogger post here:
http://visinf2014.blogspot.co.uk/2014/12/3d-installation.html
Further information can be found on the blogger post here:
http://visinf2014.blogspot.co.uk/2014/12/3d-installation.html


NL vs UK Comparison - Digital Interactive
Due to the unique way Behance is powered I can't upload an example of my final interactive project due to it being made in flash. Here is a link to the fully interactive version of the solution - http://www.fastswf.com/eHCpCnM - Below are a few images of the project.
Further information can be found on the blogger post here:
http://visinf2014.blogspot.co.uk/2015/01/comparison-between-nl-uk.html
Further information can be found on the blogger post here:
http://visinf2014.blogspot.co.uk/2015/01/comparison-between-nl-uk.html


