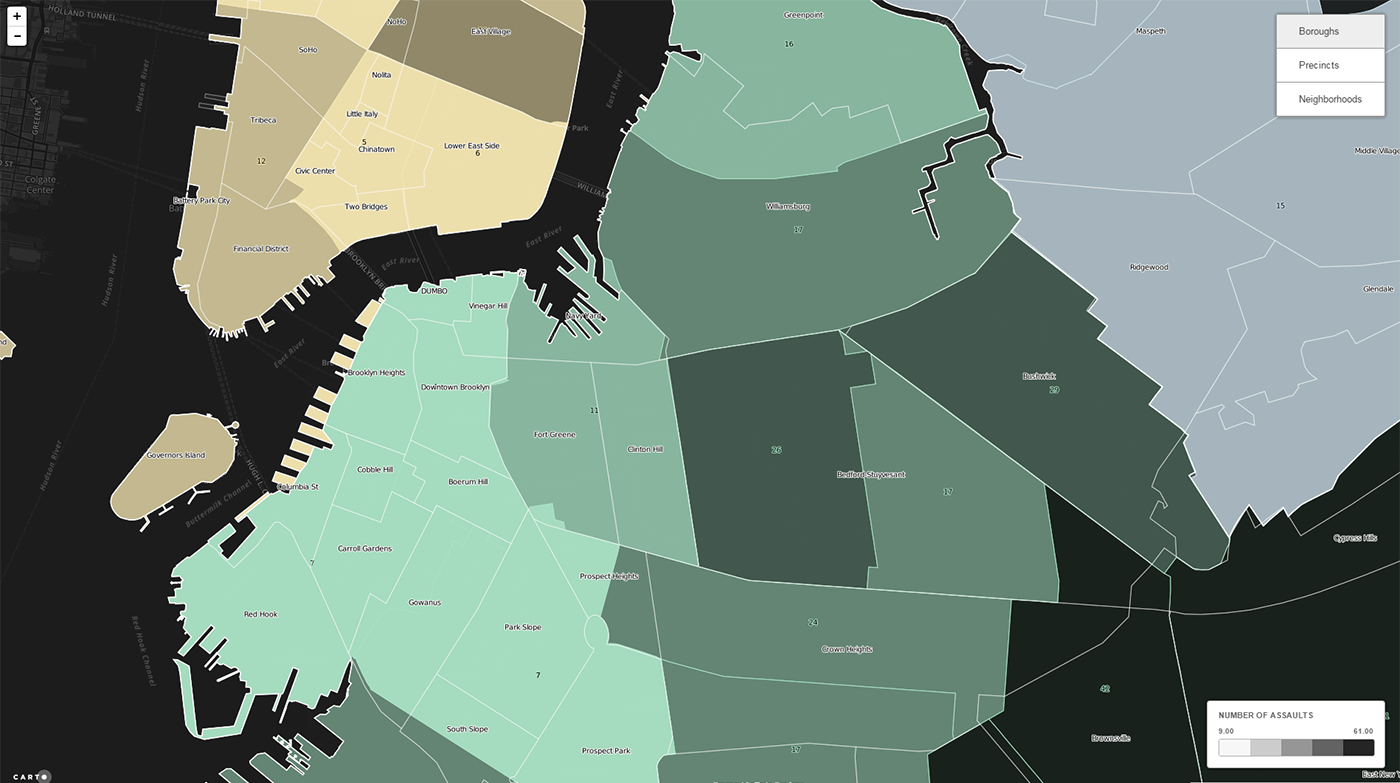
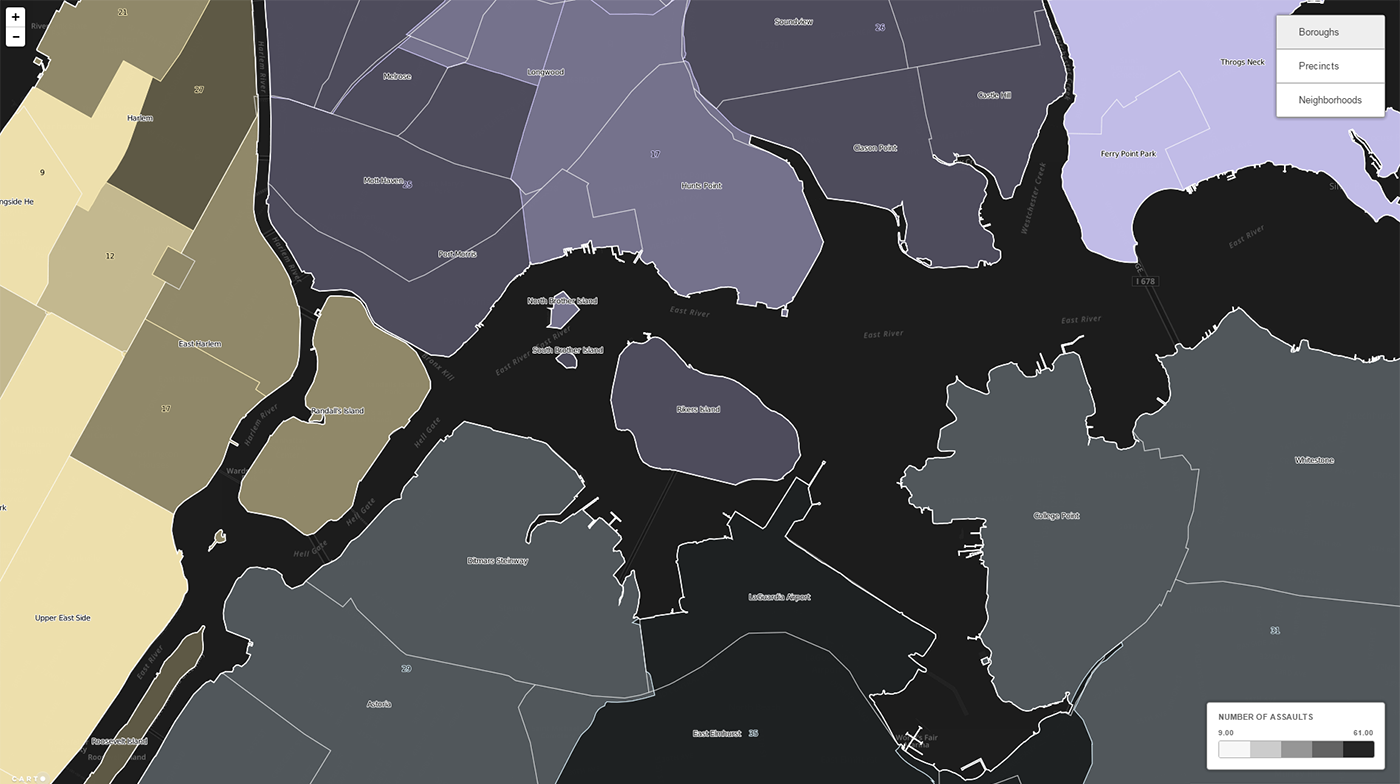
An Interactive Cartographic Visualization
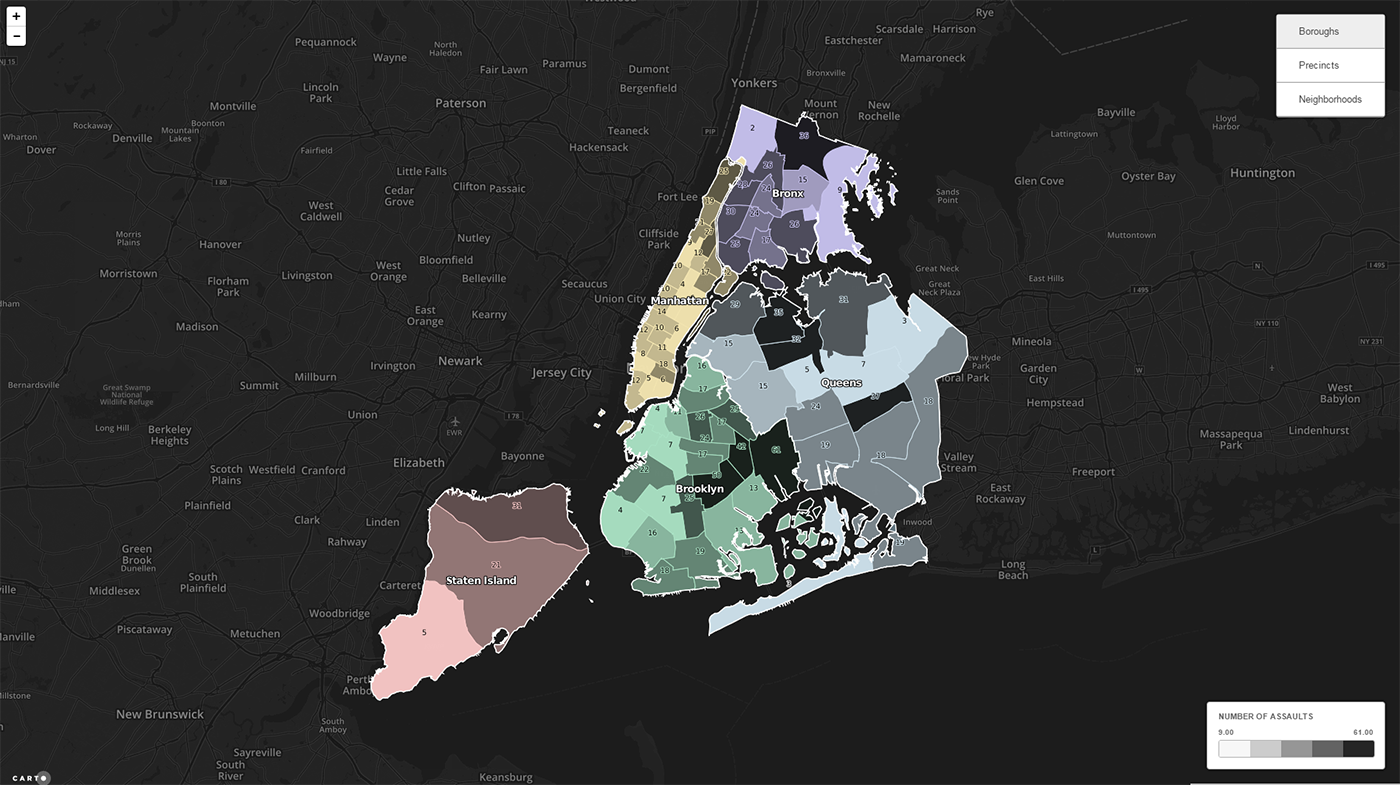
This map is an interactive cartographic visualization of the number of reported rapes per precinct in NYC based on 2013 annual report data.
I am socially active, most particularly in areas relating to women's issues and rights. While this data is not pleasant to think about, it is nonetheless relevant and important to women living in the city.
I used CARTO.js to make this map.
Here the precincts are outlined and filled grey-scale. The numbers represent the number of reports within each precinct.
The higher the number (more sexually violent) a precinct is, the darker it appears on the map.
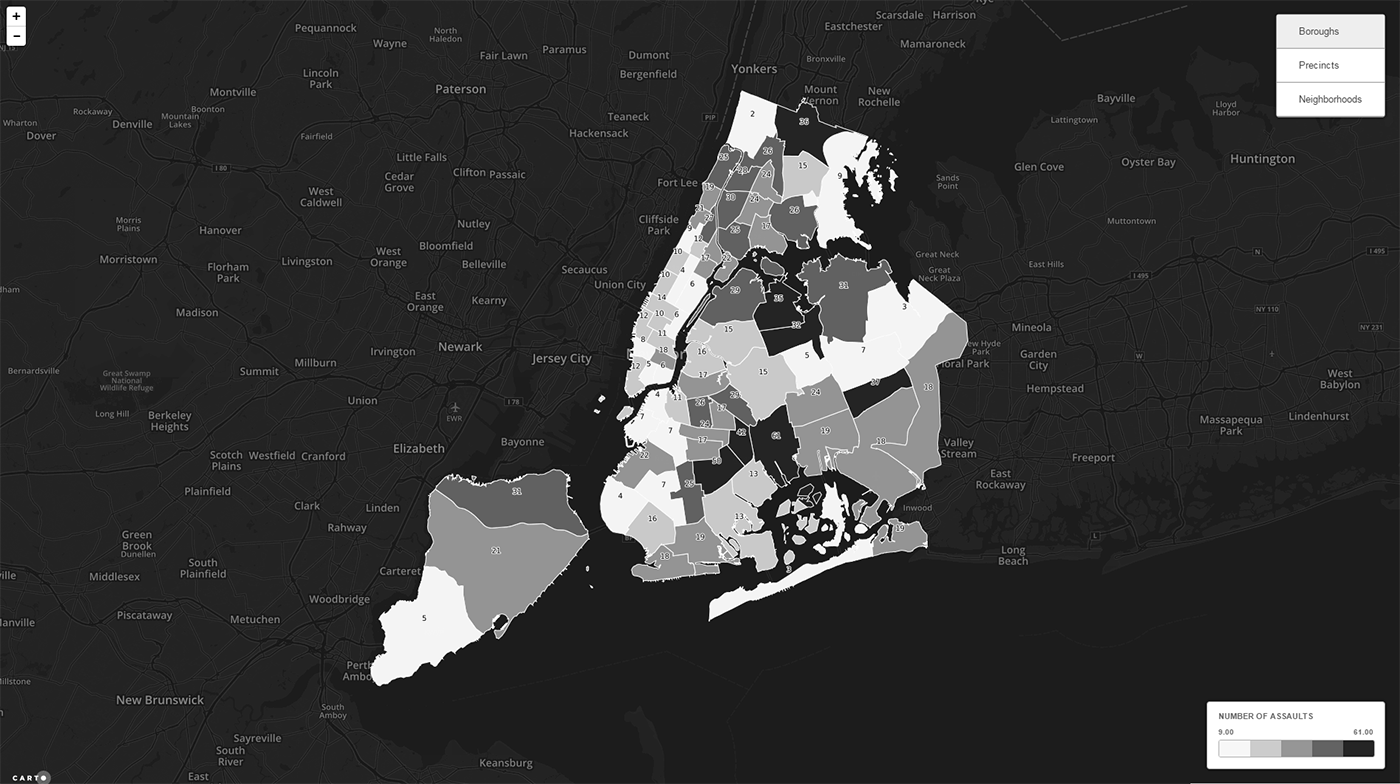
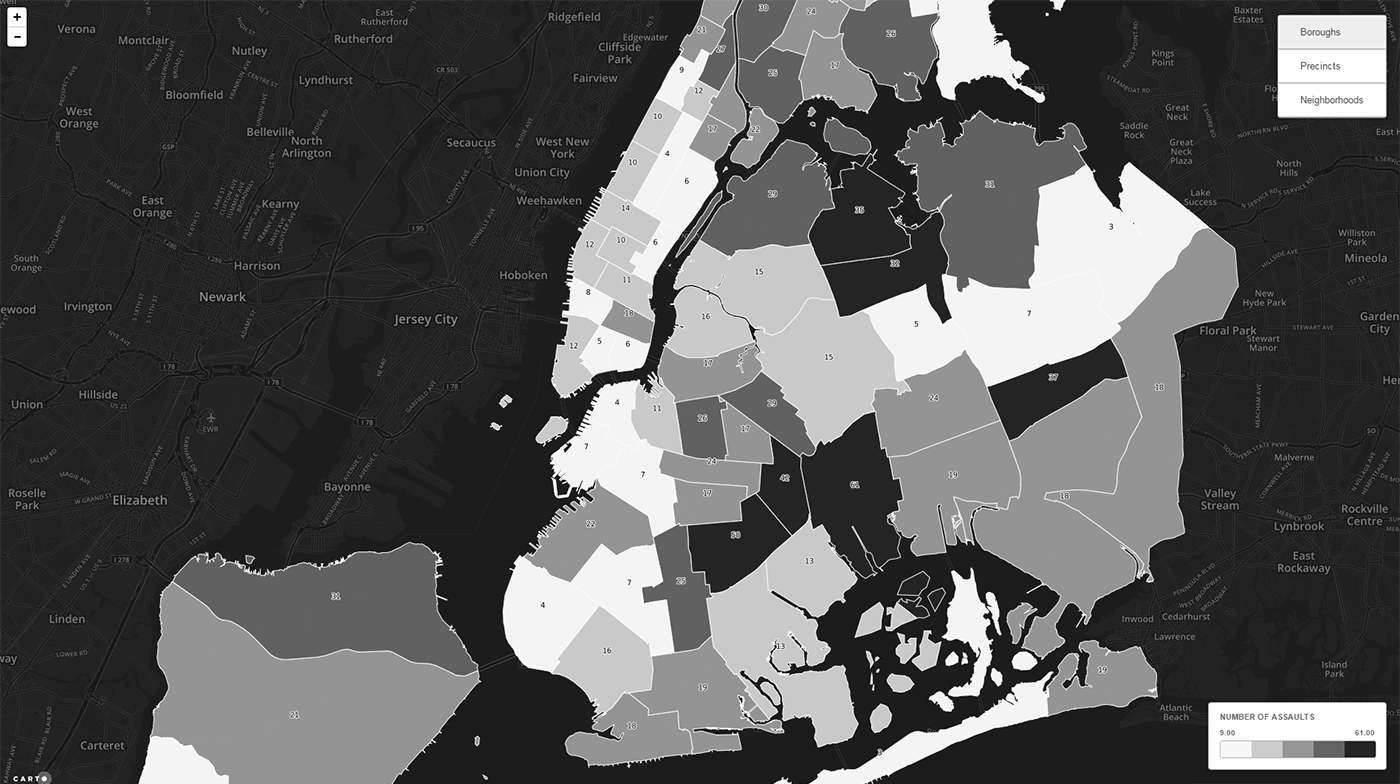
The Boroughs are colored transparencies; the light/dark shades of the precincts are carried through the colors.
Neighborhoods can be plotted overtop of this information by clicking the 'Neighborhoods' filter.
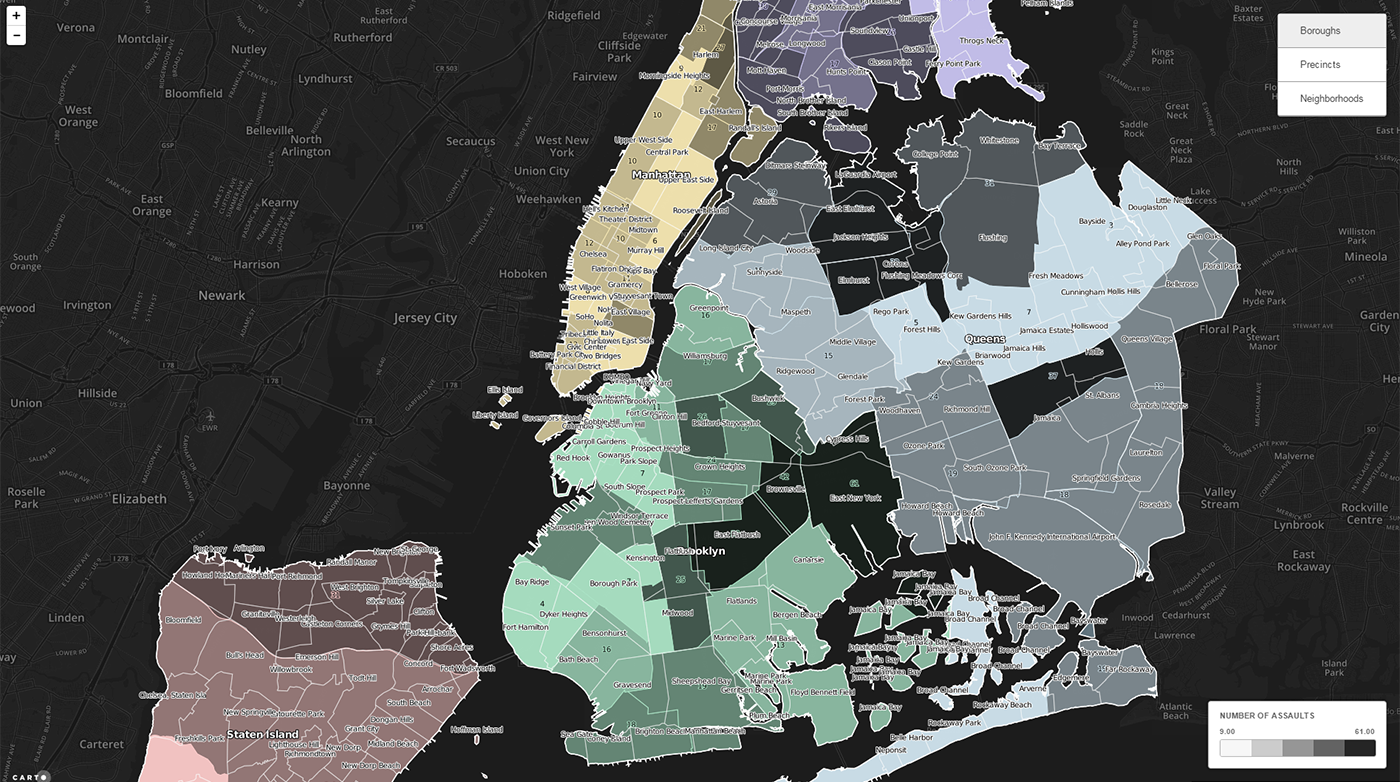
Neighborhood information is better observed at closer range