

MARGINALIZED!
An Infographics Project
An Infographics Project

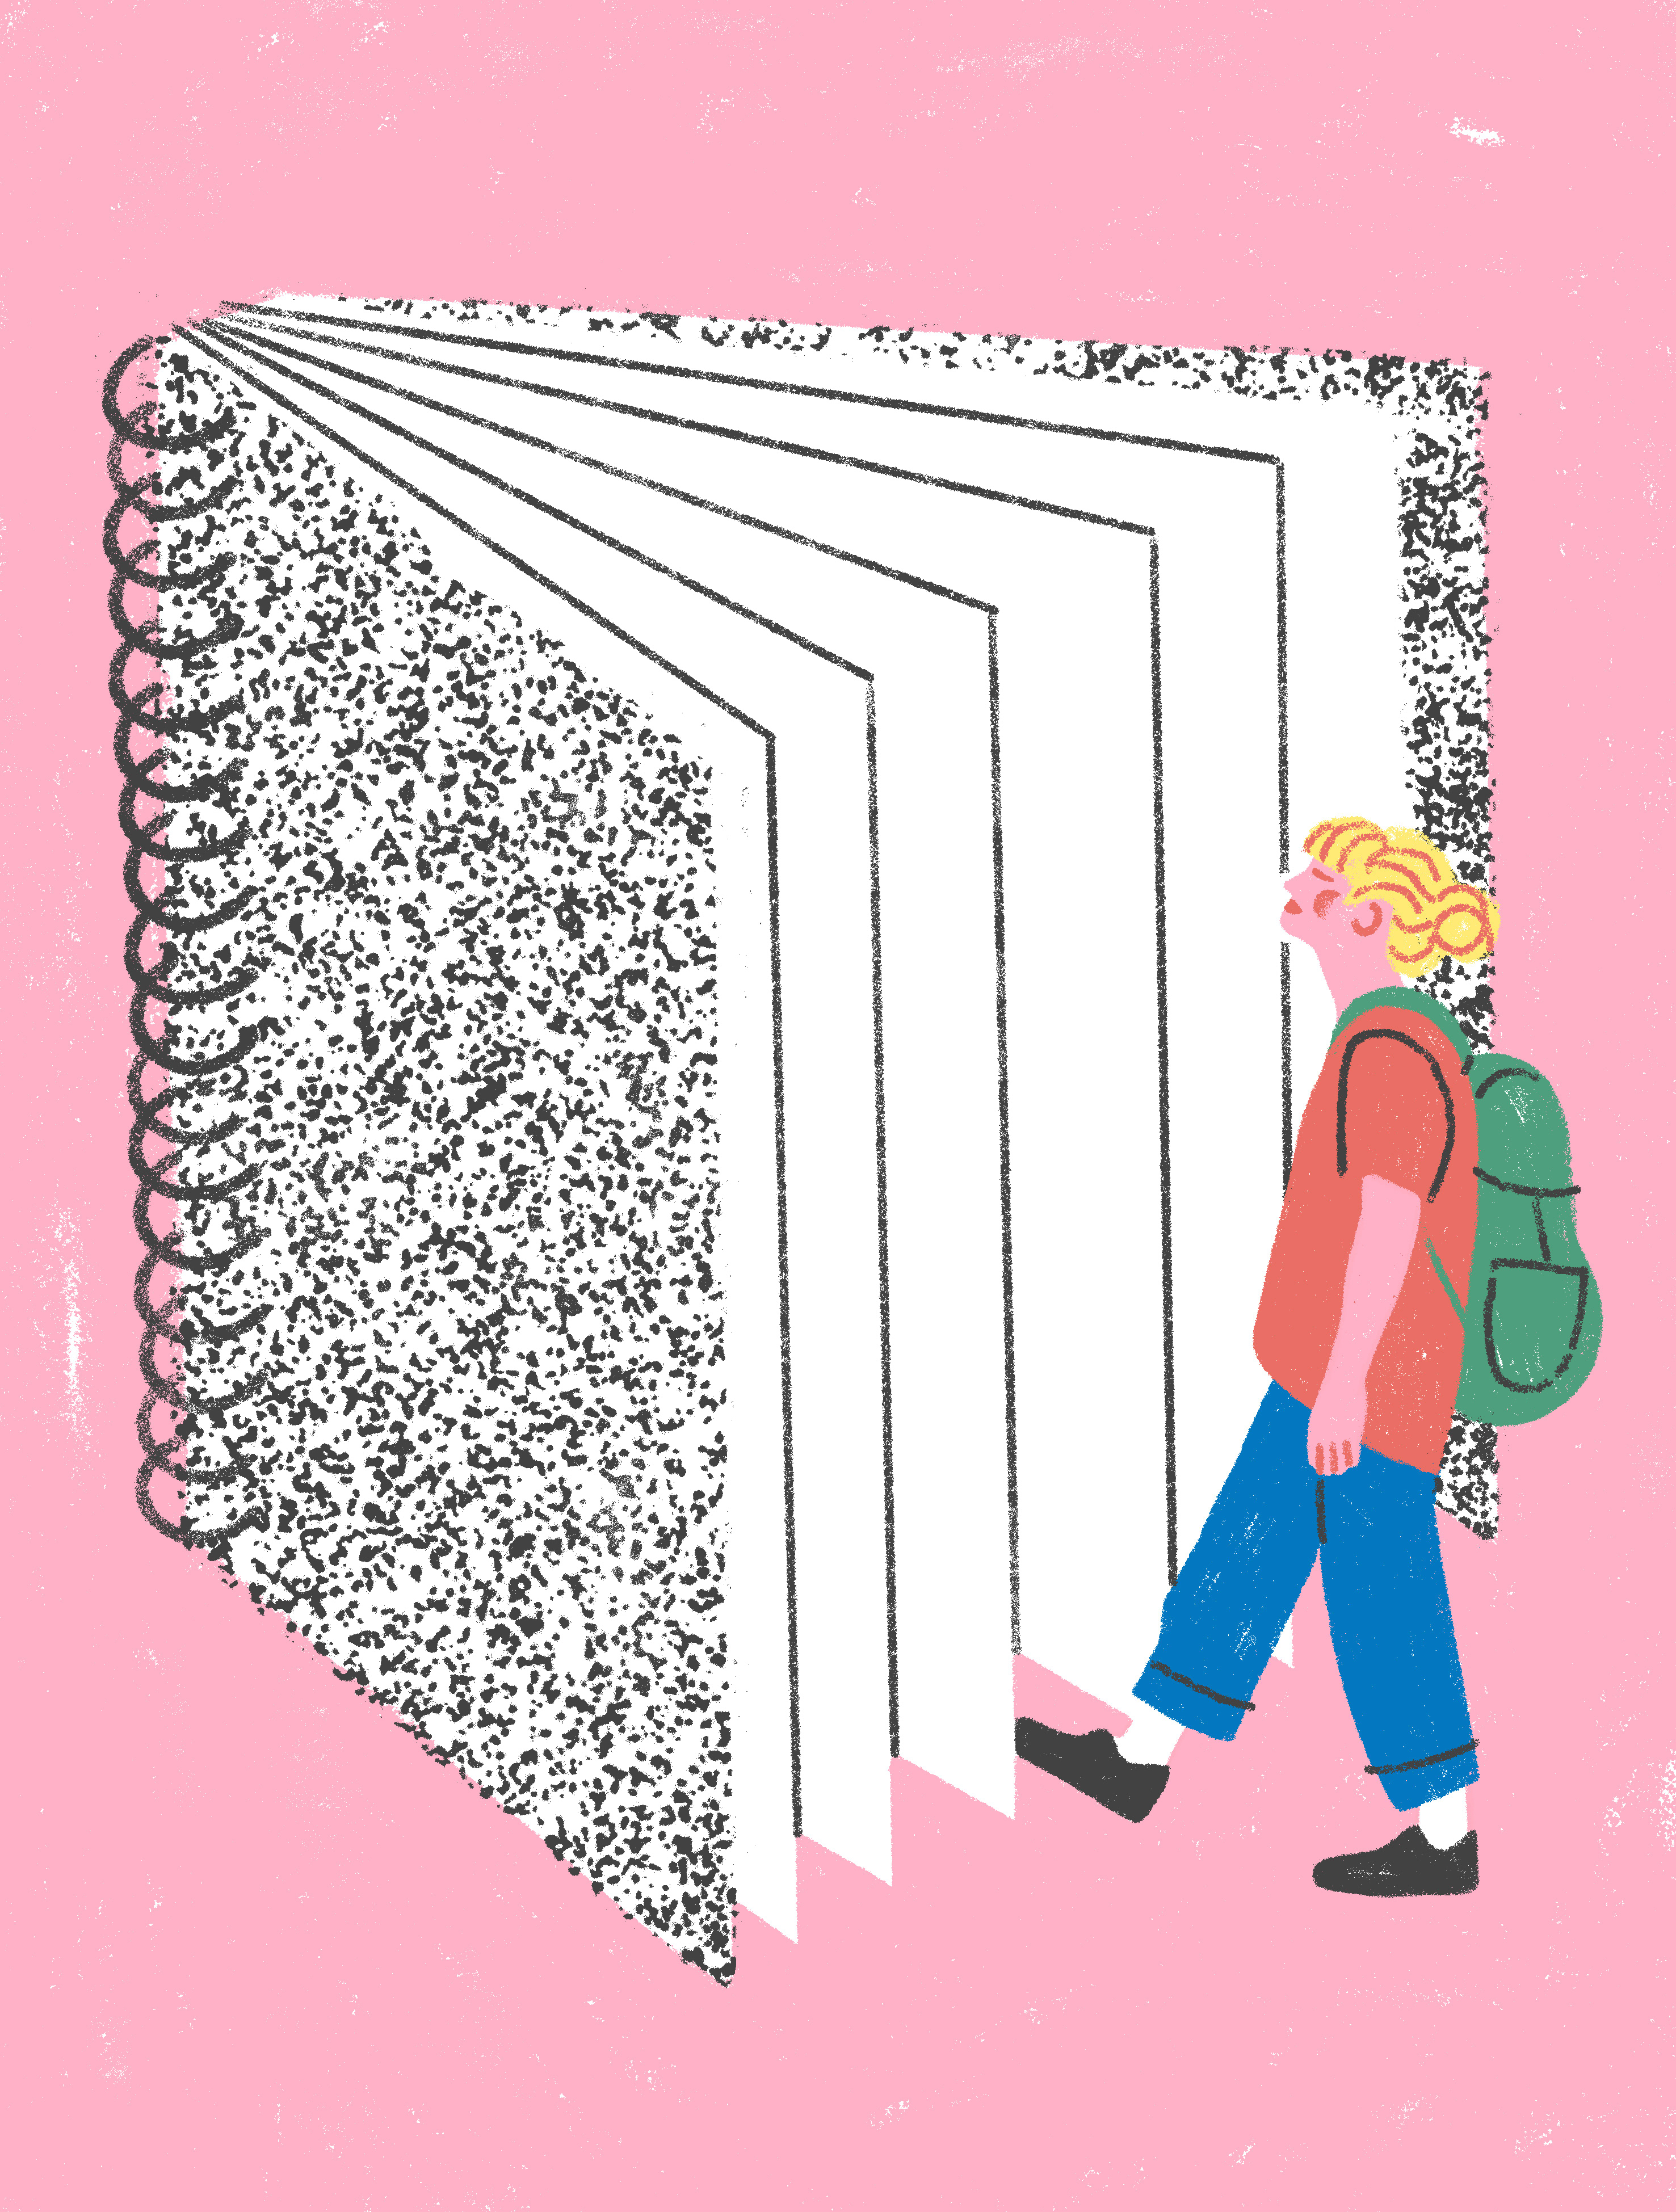
This project was the result of an entire semesters worth of work. We were asked to research a cause that interested us, and create an infograhpics project from that. The pieces for the project were a magazine, a poster, and a website. My topic was about the marginalization of women in the comic book field. This theme influenced my design, in the bright poppy primary colors used, the speech bubbles, the halftone backgrounds, and the line work illustrated images.

The cards would be passed out at conventions to generate interest in the topic of the marginalization of women in comics, and to promote the website. Each card has a graphic of the category it is from and a statistic about women within that area of comics. The colors are bright and colorful to grab your attention, with the stark black and white image standing out.

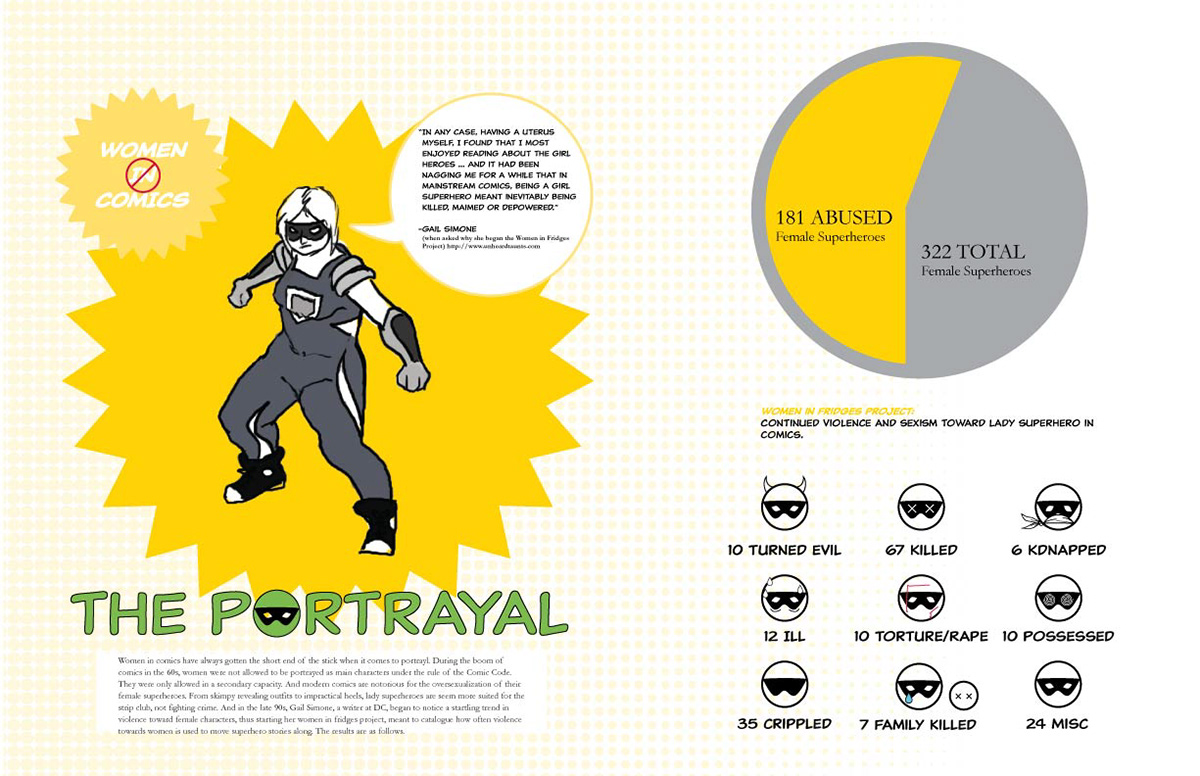
The following spreads are part of a magazine layout that focuses heavily on information graphics to easily and quickly convey the concept. The spreads focus on women in 3 categories of comics and give statistics about their prominence, abuse, and under representation. Each spread has a bright primary color, reflecting those often used in comic books. The background is a soft halftone, also a nod to comics, while the image is a stark black and white illustration representing the women in that category.


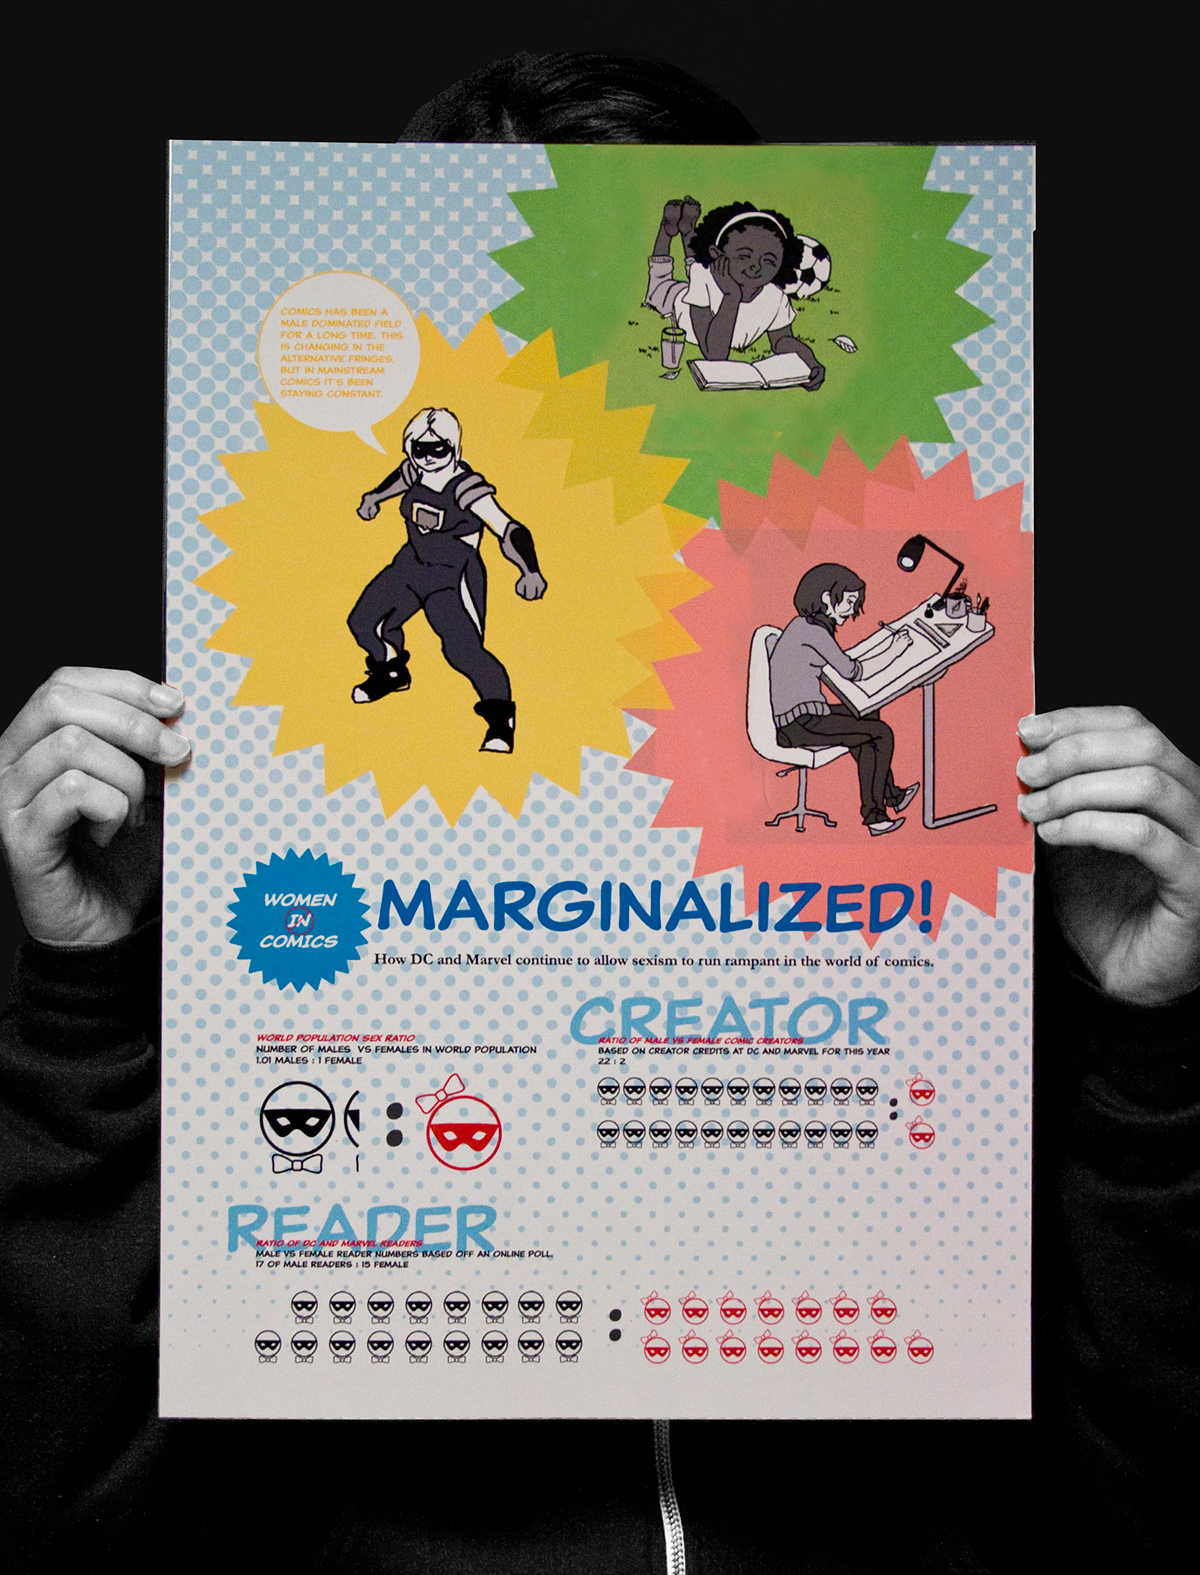
The final poster for the project. While the magazine spreads tackles each of the categories individually, the poster gives a an overall look and intro into the main topic of the marginalization of women in comics. Icons used in the magazine are modified and reused here to create cohesiveness between the two items. All three drawings are used on the poster to show that these categories about women are represented.


