© Katja Budinger | Stéphane Flesch | Roman Grasy | Kathi Veitengruber
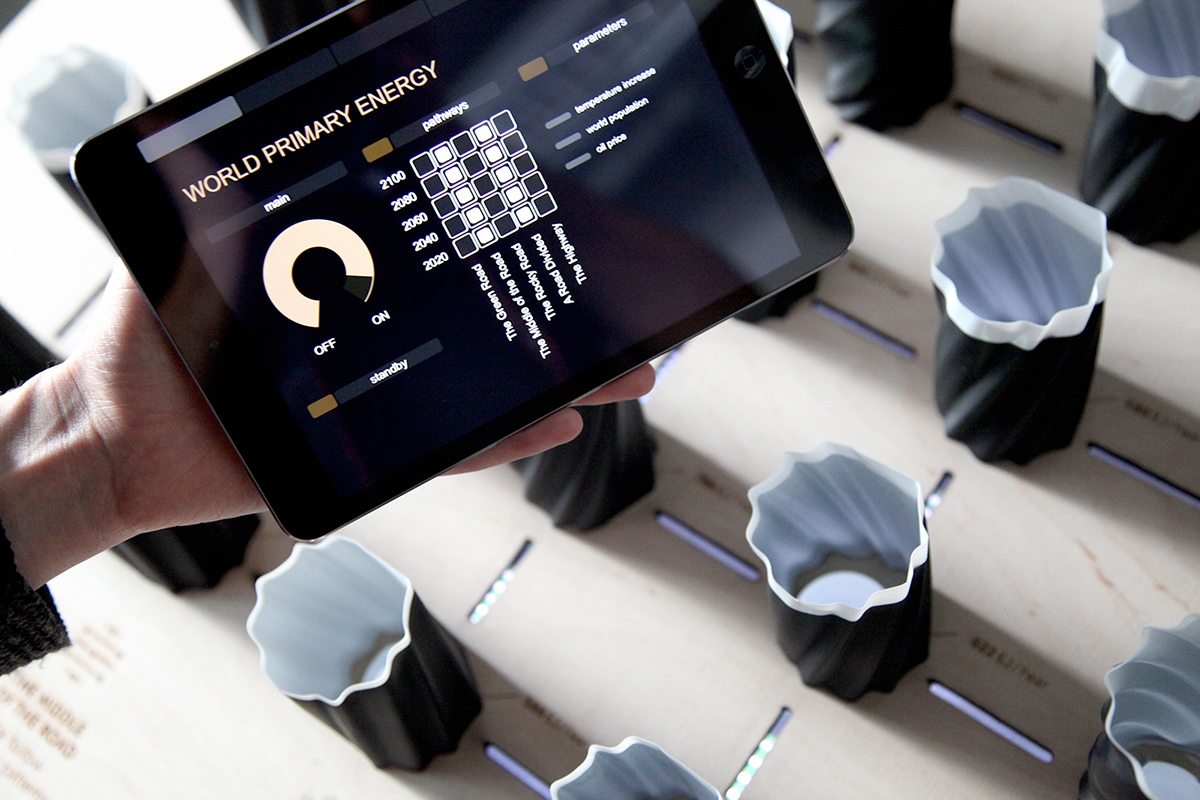
WORLD PRIMARY ENERGY consists of 25 3D printed pillars representing future energy consumption. We examined the worldwide development of energy consumption from 2020 to 2100 throughout 5 future scenarios. Additional parameters, such as temperature increase or the growth of populations, are added by rear projection through a laser cut. The object is operated with an app. The data set is provided by the Potsdam Institute for Climate Impact Research and offers multiple angles and dependencies. Our physicalization supports analysing and comparing excerpts of the database. Further it illustrates the complexity of the subject and stimulates discussions about future climate scenarios.

WHAT ARE THE SHARED SOCIO-ECONIMIC PATHWAYS? The climate change research community is developing new scenarios integrating future changes in climate and society to investigate climate impacts as well as options for mitigation and adaptation. One component of these new scenarios is a set of alternative futures of societal development known as the shared socio-economic pathways (SSPs). The SSP narratives are a set of five qualitative descriptions of future changes in demographics, human development, economy and lifestyle, policies and institutions, technology, and environment and natural resources.


Read more: O’Neill, B.C., et al., The roads ahead: Narratives for shared socioeconomic pathways describing world futures in the 21st century. Global Environ. Change (2015), http://dx.doi.org/10.1016/j.gloenvcha.2015.01.004
The height of each object represents the global consumption of primary energy per year. Each object is divided in renewable energies (white) and fossil fuels together with nuclear resources (black). The rotating form shows the distortion of energy developments in the future scenarios.The pillars are placed on a two-dimensional grid. The y-axis shows the time from 2020 - 2100. The x-axis shows the Shared Socio-economic Pathways.


The app-controlled projection allows to highlight objects and compare several pathways to focus discussions or presentations.In order to stimulate deeper understanding. We included additional data parameters that contrast or support the energy data. Our prototype includes global temperature developments and the growth of populations. For each additional data layer we developed own projection metaphors to distinguish the data source.


FROM DIGITAL TO PHYSICAL
1. Computational Model
During the development process of this object we developed a tool, which allows us to read the data set and project the parameters to visualizations. Using this method, we were able to deeply study and analyse the dataset. We used the tool to find related forms, calculate values for the building process and experiment with different appearance characteristics. To program this model we used the development environment VVVV.

2. Projection mapping
Beneath the computational model, we experimented with rear projections on and through different surfaces. We decided to work with laser-cutted wood as canvas tor the abstract projection.

3. Rapid Prototyping and Production
The final form models are generated in VVVV and Grasshopper. We used a 3D printer (FDM) to built the 25 energy pillows.


The ground plate was designed in Illustrator and prepared for a laser-cutting machine. The projector is linked with a mirror inside a case and leads the projection to the ground plate, where the objects are placed on top.

"World Primary Energy" could be seen as starting point for further iterations. The projection of more data sources offers various possibilities to stimulate insights and discussions. Nearly any social and economic parameter can be linked to the development of energy resources. The comparing layer is auxiliary to understand connections within the PIK data model.
The rotating form language is a strong stylistic device and could cover other parameters, such as social developments.
It would represent the deformation of society, which will enrich the object with a critical level.
It would represent the deformation of society, which will enrich the object with a critical level.

