
This project is an experimental experience using real-life data from the CBS (Centraal Bureau voor Statistiek) in the Netherlands during a five month study period. The project compares data from the Netherlands with that of the UK on how many unemployed people are at risk of being below the poverty threshold. It's an interactive design that makes you experience the data, putting the user in a mode of frustration, panic and confusion, reflecting what emotions people in the data group must feel being faced with poverty.
The brief was to take any dataset from the employment sector (this could be any data on job rates in any city, what sector was employing more, ect.) and to make an interactive visualisation with the data that I had chosen. The brief was rather open but one element was not: an Interactive Visualisation needed to be produced. For this project I had decided to use the programming sketch program "Processing" to make my visualisation, it wasn't a programming platform designed much with interactivity in mind and was difficult to get working but it eventually turned out exactly what I intended for the data I had chosen. The lack of user-friendliness and clunky visuals added to the feelings I wanted those using it to feel.
Target audience was a difficult one to place, the audience are those curious enough to grapple with the idea and understand what story it's trying to say, those interested by the subject matter of unemployed being beneath the poverty threshold and the data behind it. It certainly is not an interactive visualisation for everyone and isn't marketable, but that wasn't the intention, the intention was to make a point.
I haven't touched any coding in my life, I had heard about rules and syntax from friends who knew coding, but never implemented it myself. That was the biggest challenge during this project, I had to learn the program and know how to get what I wanted by myself in four weeks. It was a stretch but the end product speaks for itself; clunky, heavily stylised and un-polished, everything it was meant to be!

A mock-up of what the visualisation splash page looks like in full-screen. The buttons show both data sets: light blue for the Netherlands, sea blue for the UK.


Upon hovering over the buttons stripes appear across the screen, the first element of confusion.


Lines stem from the "Poverty". Each section is a year and has twelve line segments which all follow the users mouse, the higher the data figure connected to each segment, the heavier that segment is.

Since the Netherlands data segments are only up to 97,034 they move rather quickly compared to the UK which has a highest figure close to 800,000.

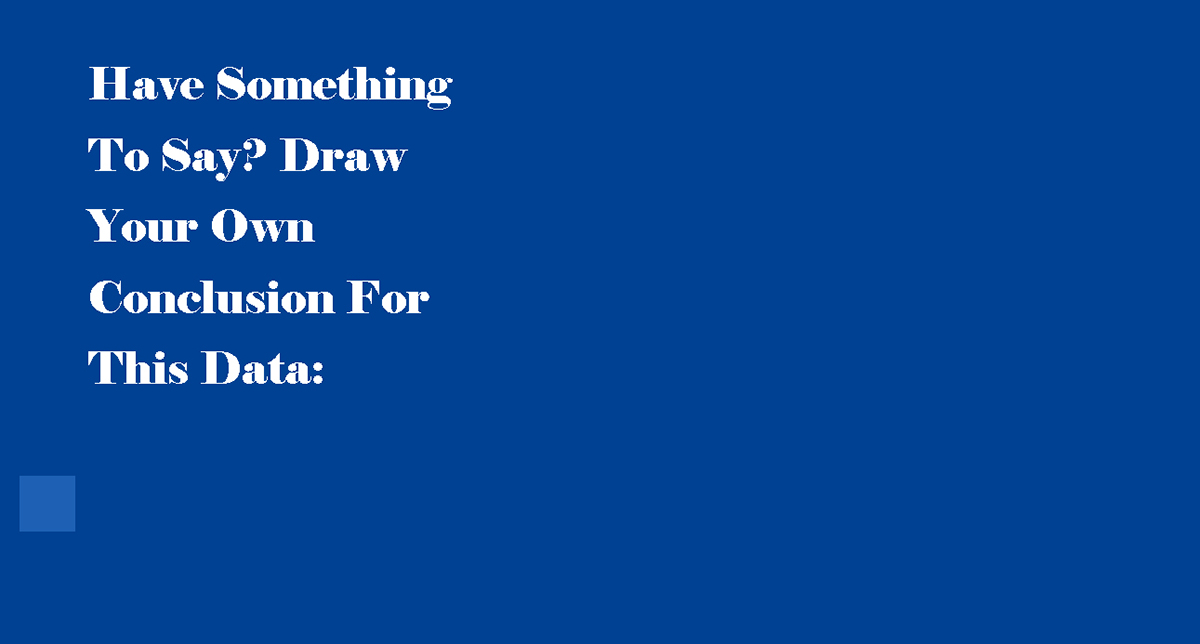
This page acts as a user feedback page. Hold down the mouse button to draw onto the page, simple enough. The only issue is that the mouse makes a small trail but nothing is ever permanently left behind. It is meant to cement the element that unemployed people at risk of being below the poverty threshold don't often have a voice to be counted, other than being figures in a dataset.
A short exploration of the visualisation in action. All of the elements which cannot be seen in screenshots are visable during this short video.


