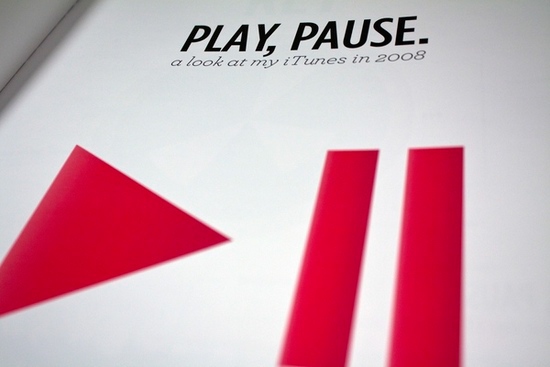
Play, Pause.
A look at my iTunes in 2008.
Infographics Project, August 2009
Collection of statistics from last.fm and iTunes statistician.
A look at my iTunes in 2008.
Infographics Project, August 2009
Collection of statistics from last.fm and iTunes statistician.
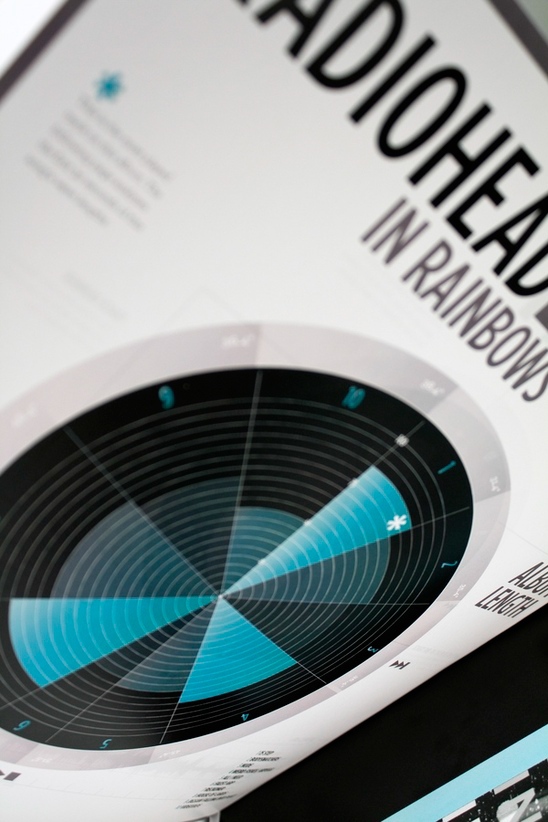

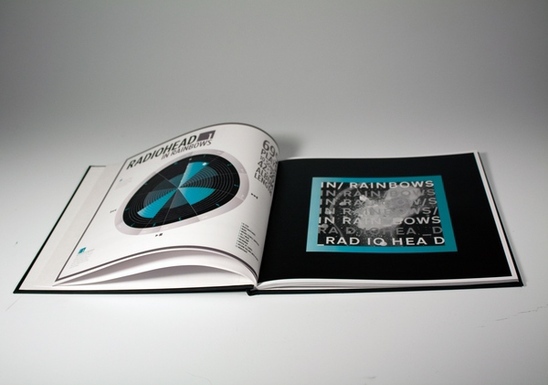
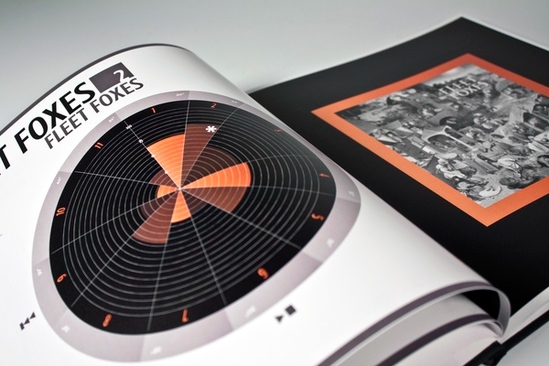
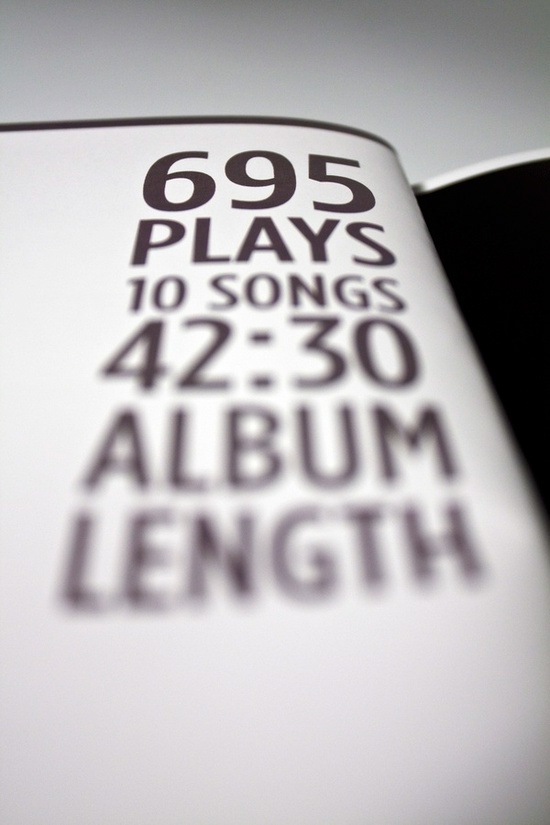


This data shows the tope ten artists and albums played through my iTunes in 2008. Similar to that of a vinyl record or compact disc the rings represent a track on an album. Each album has a set of rings that are the track numbers. The inner-most ring will always be track number one and the track that is the furthest from the center will always be the last track. The stroke weight states exactly how many plays have been recorded on that track for that specific album. The stroke weight is based on a point scale with 10 point being the greatest at one-hundred plays and 0.1 weight being the lowest at one play. The stroke weight determines the amount of plays. The heavier the line point the more plays the track has. The colors coordinate with the data and each artist and album has a unique color to represent the data rings. Each set of data rings are numbered, that number is the rank for the album as well as the number of plays in 2008. The overall data collection of this poster states that there are 10 albums, 113 tracks and 5,442 plays from the top ten artists played over 2008.

