Facebook came to ISL early last year with a challenge: how could we create a data visualization that would allow attendees of their conference F8 to explore their Trends API? Less interested in a user finding specific information quickly, and more interested in a playful experience for attendees that showcases the API, Facebook set us free to explore the challenge.
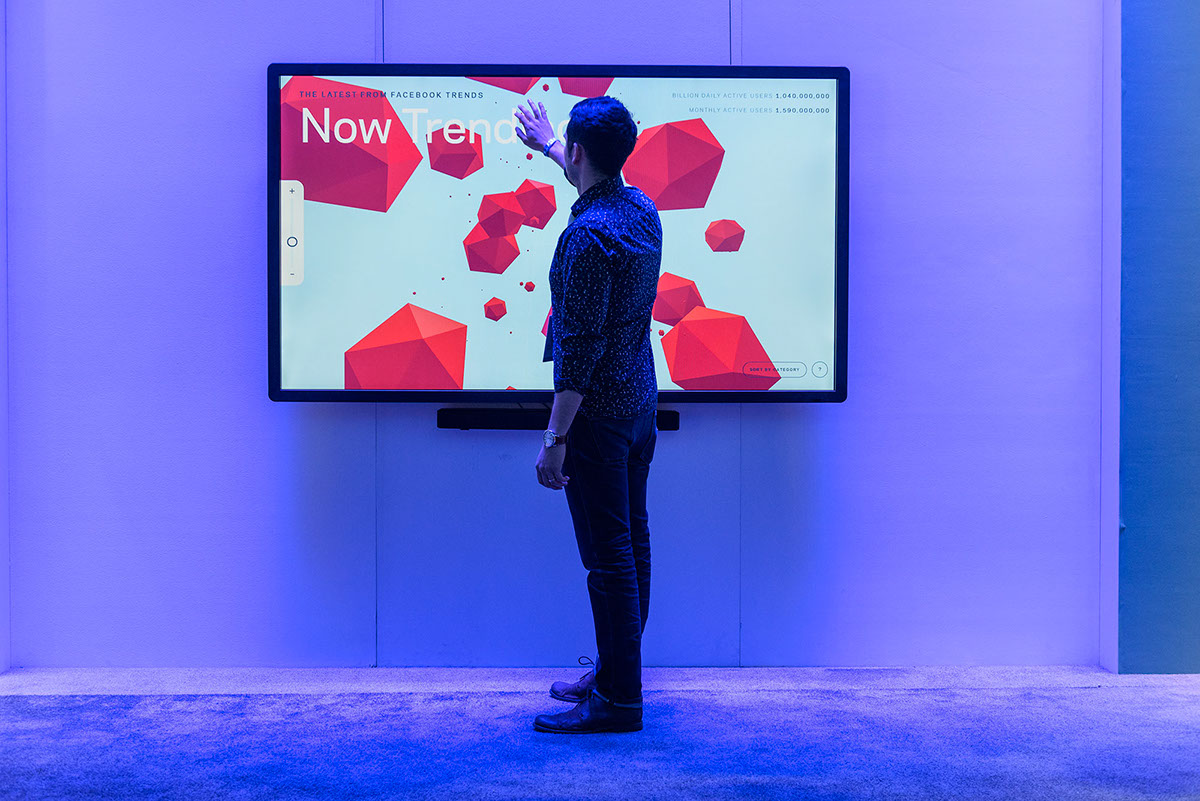
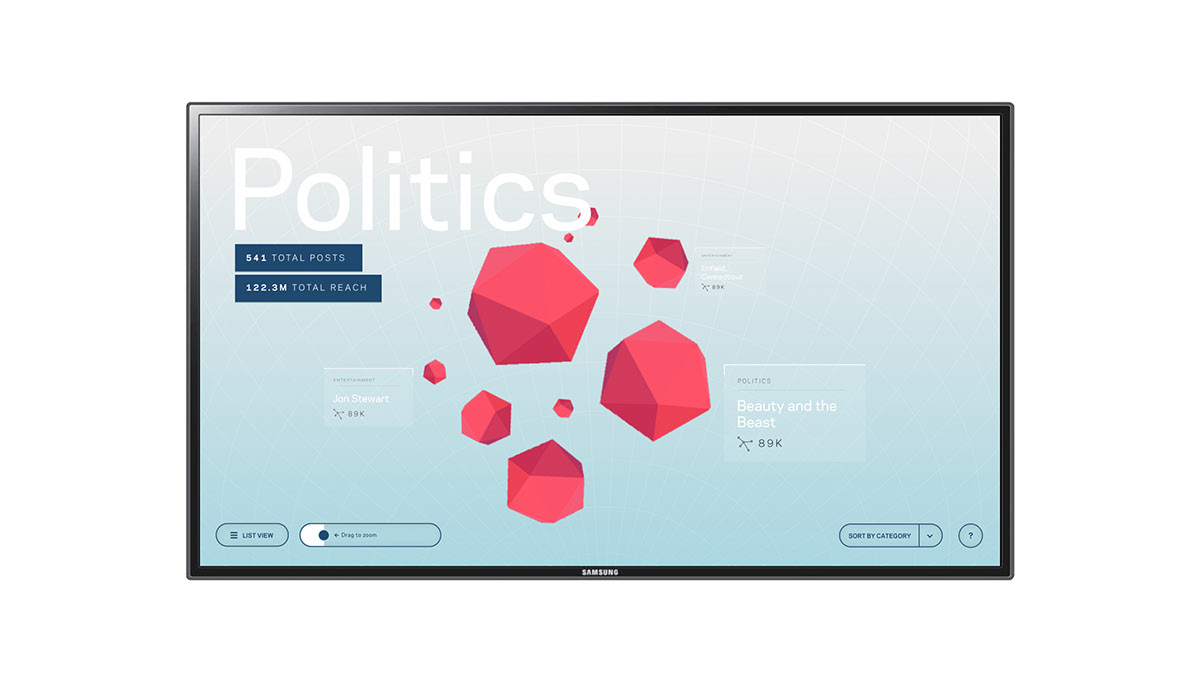
We came up with a 3D web gl based "universe" of shapes that lives on a giant touchscreen. The user can swipe and zoom to interact with the shapes, and tap a shape to delve into the details of that trend. Last year, the visualization was a great success at the conference, so the client asked us to make them a product that they can deploy at various events, offices, and brand locations throughout the country.
What resulted is a customizable display that allows a Facebook admin to curate the trends that go into each visualization, edit the colors to match the screen's surroundings, and generally customize each instance of the display to best suit their needs.
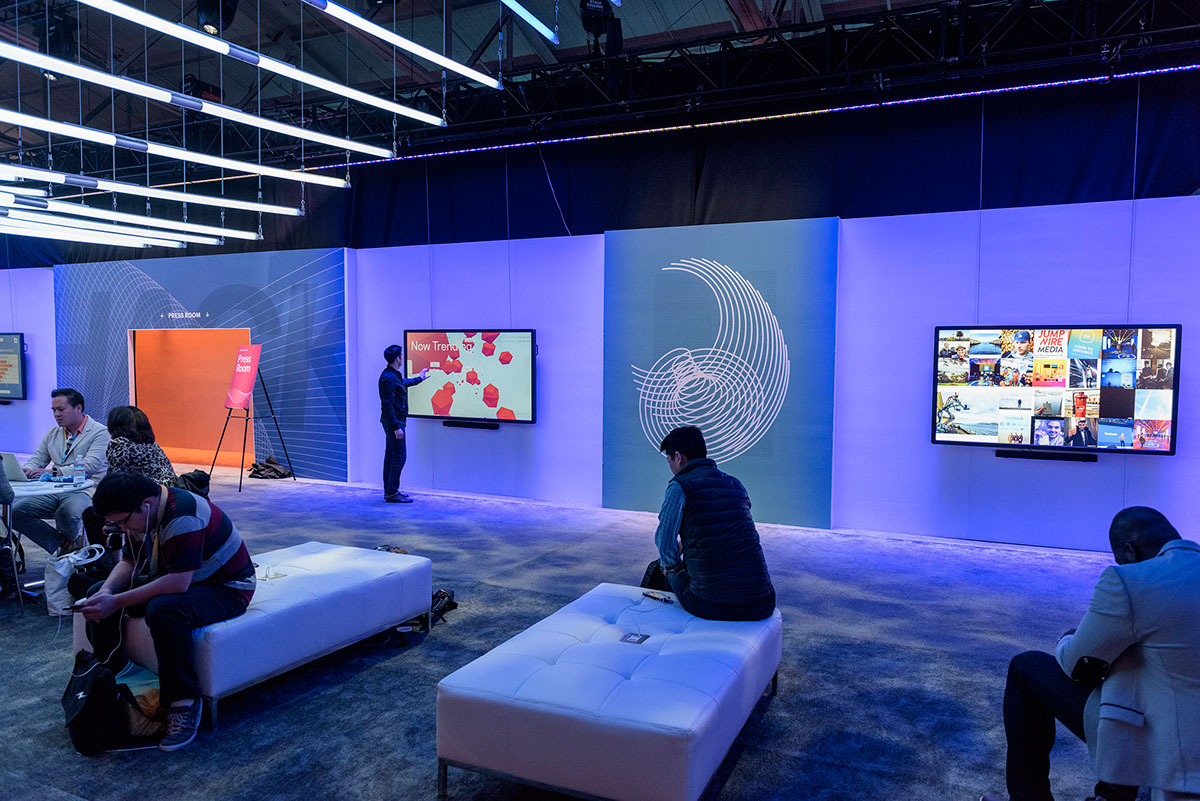
The Facebook Trends Visualization at its second FBF8 conference.
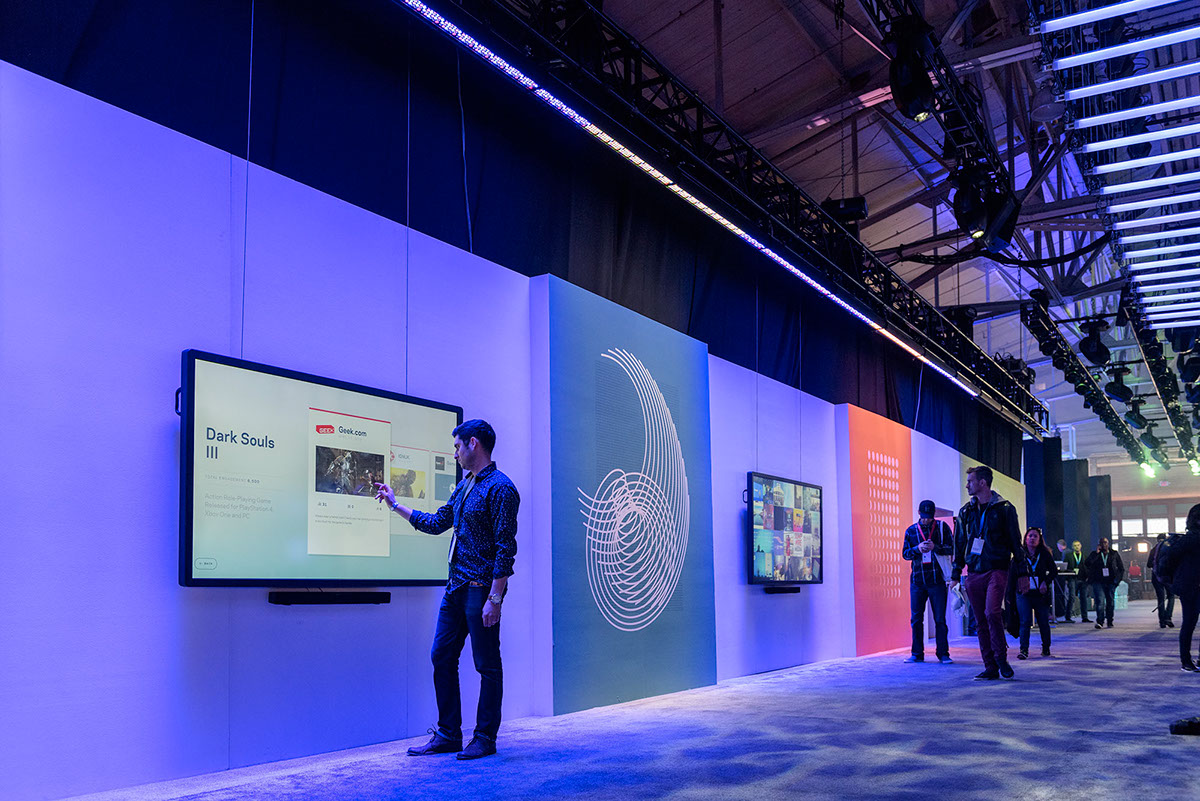
An early iteration of the viz. We realized that transparent cards on top of a 3d scene was impossible, so we ended up going with the darker cards (below). The UI elements for the 2nd phase were also tweaked for ease of use.
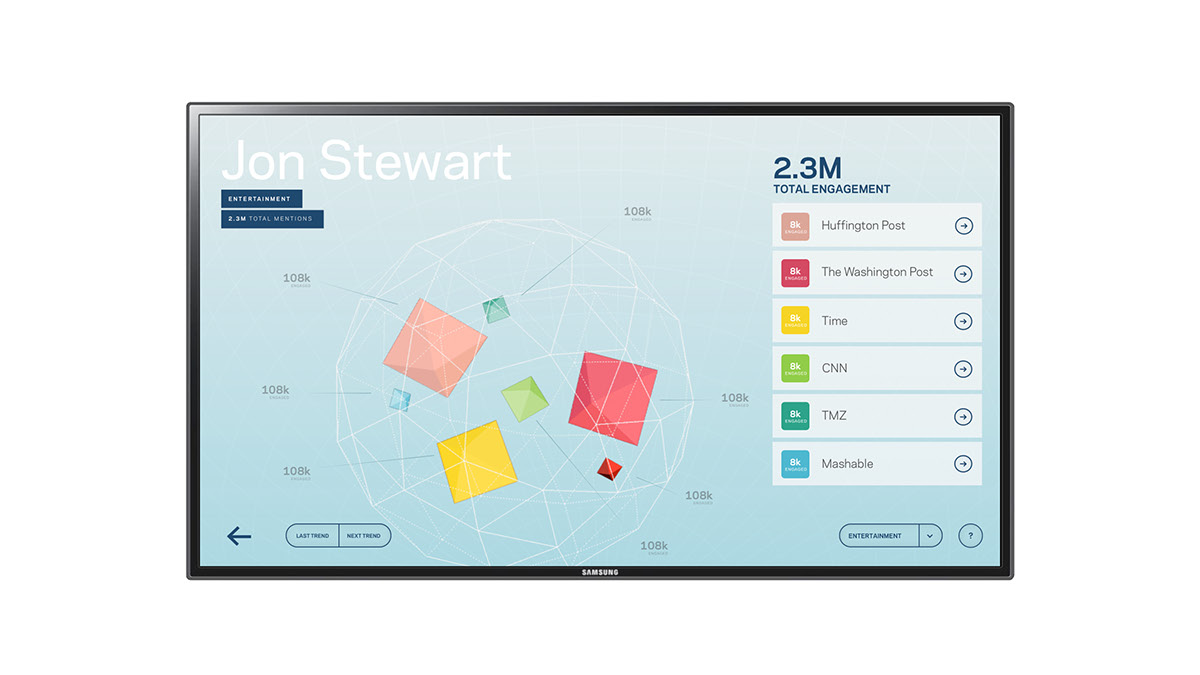
The first version of Level 2 showed a wire outline of the Level 1 shape with the topics inside of the trend as clickable 3D shapes. In execution, it was clunky and less than beautiful for many reasons, so we ended up with what you saw in the second photo at the top.
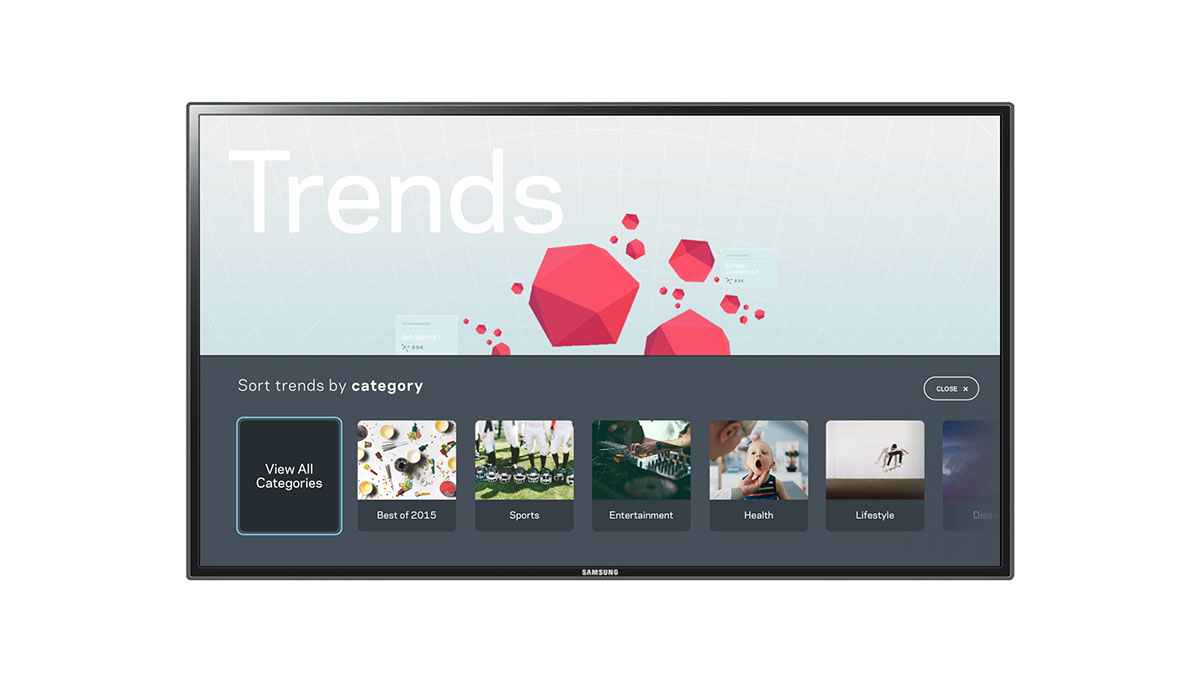
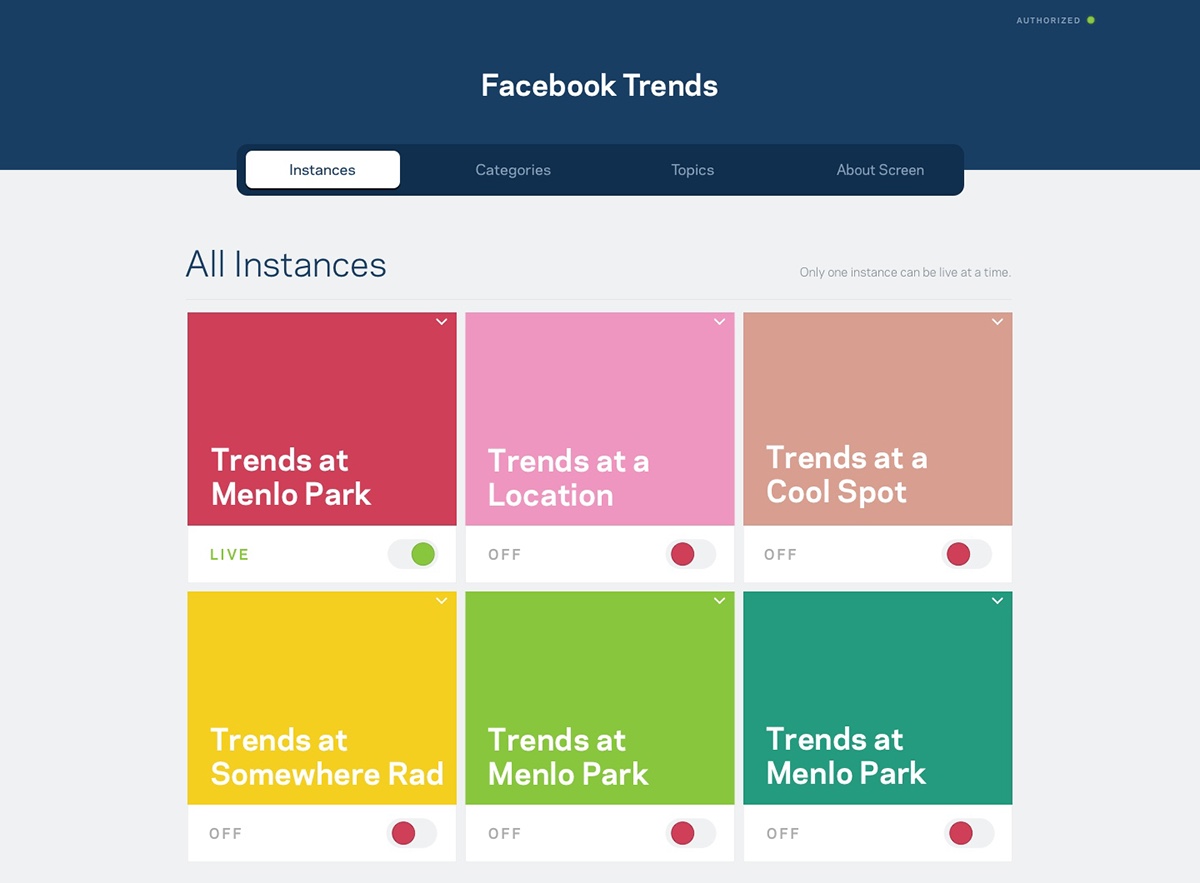
The admin console is still in development, but the essence of it is that the admin users can edit the content in each different visualization so that it's fitting for where it's being displayed — for example, if one instance lived in a sports-enthusiastic place, the sports trends could be curated to show up first, so that the users would see content that they're more interested in.
The Team
Creative Direction: Zach Goodwin
Front-End Development & WebGL Wizardry: Eli Fitch
Back-End Development: Johnny Austin
Admin Console Front-End: Thomas Degry
Project Management: Audrey Matthias


