


The pre-project reflection on practice includes the identification of the current issue regarding the South African textile industry


Inspiration drawn from a local conscious fashion designer - Mia Nisbet


Inspiration drawn from conceptual fashion artists remixing and recycling textiles - Second Lives exhibition


Experimenting with Silk Screen printing on textiles as further extension of the project


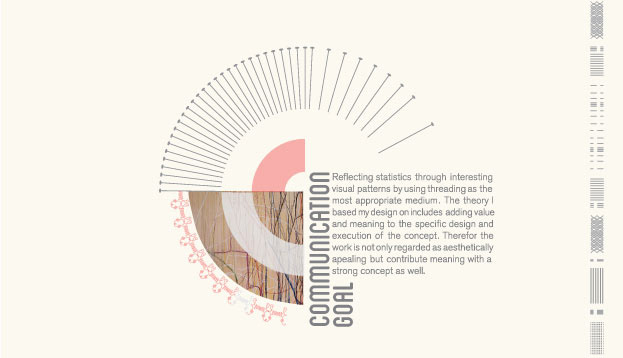
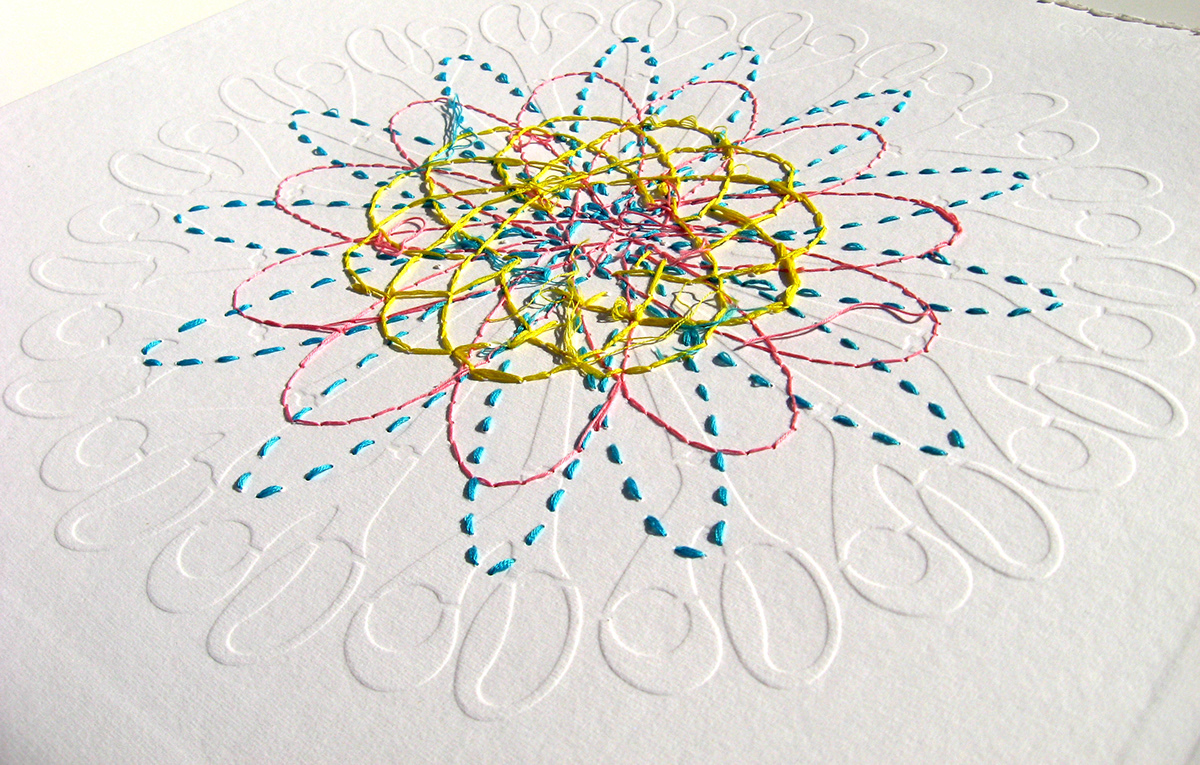
Information graphic 1 represents job losses in the South African textile industry in 2008:16 500, 2009:14 516 and
2010:10 000. Each year is visually represented in a different colour, 2008:blue, 2009:pink and 2010:yellow. The
threading varies in density according to the specific figure represented.
threading varies in density according to the specific figure represented.

Information graphic 1: detailed view of threading
Information graphic 1: isometric view


Information graphic 2 represents the visual interpretation of statistics regarding the imports of made-up textiles and the imports of clothing into South Africa during a period since 2001 to 2006. The imports of made-up textiles is visually represented through the purple illustration where as the statistics regarding the imports of clothing into South Africa is represented by the yellow illustration.

Information graphic 2: detailed view
- Imports of made-up textiles increased by 500% from 2001:4 900t to 2006:28 700t
- Imports of clothing into South Africa increased in 300% from 2001:139 million items to 2006:567 million items
- Imports of clothing into South Africa increased in 300% from 2001:139 million items to 2006:567 million items


Information graphic 3 represents the statistics regarding textile imports into South Africa before the implementation of the quota constraints. China [89%] visually represented by the green filography pattern in the center, where as the rest of the world [8%] is resembled in the outer pattern, except for India [3%] which is represented between the inner and outer pattern.

Information graphic 3: detailed view of filography


Information graphic 4 represents the statistics regarding the imports and exports of the South African textile industry during 2004. The imports consisting of R6 600 million and exports R3 200 million. In the visual interpretation the imports are repre-sented through the use of silver pins where as the smaller amount of exports are visually represented by the coloured pins.

Information graphic 4: isometric view

Information graphic 4: detailed view of pins


Information graphic 5: reflection of the manufacturing industry and abundance


Information graphic 6: reflection of the retail sector


