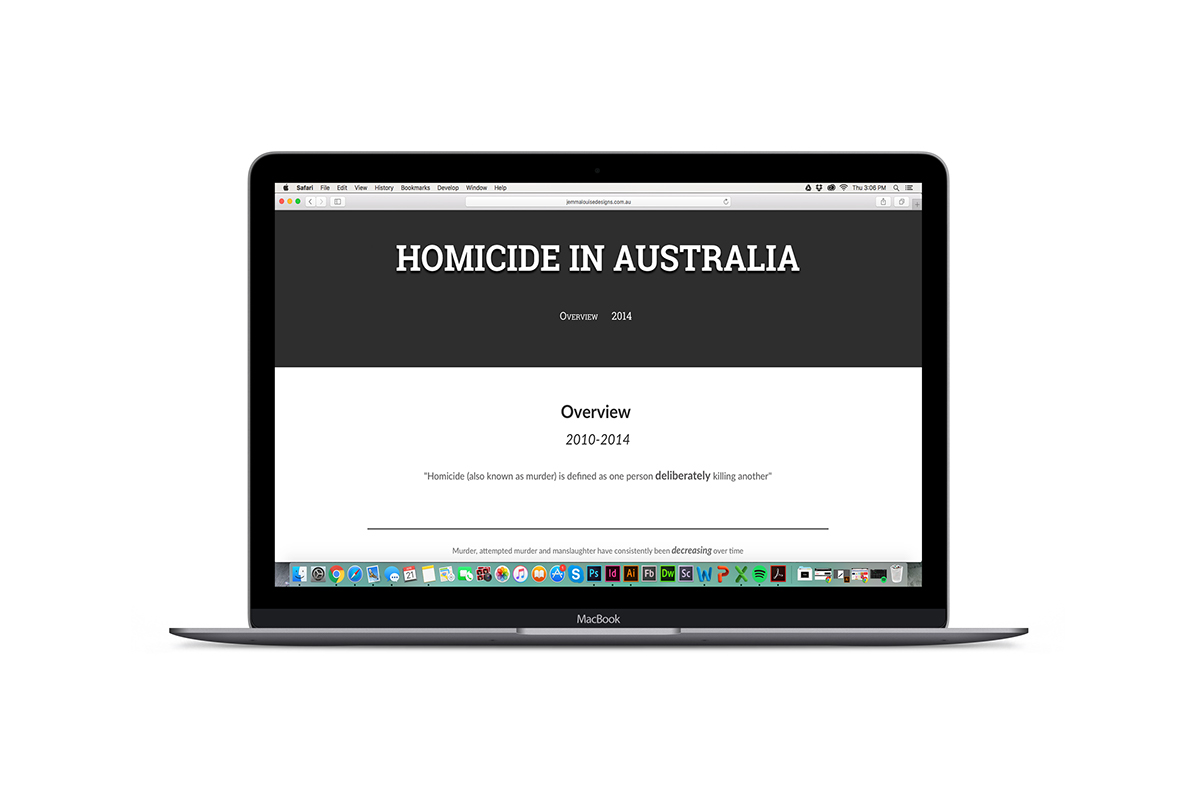


As apart of an assessment, I designed and developed this website to showcase different data visualisations for the statistics of 'Homicides in Australia'. This came about from the news, as lately all you hear about is someone murdering or attempting to murder a person and therefore I thought that it would be great to create some data visualisations to show homicide trends over the recent years.
The data was all collected from the Australia Buearu of Statistics (2014 being the latest data set available at the time), in which I then analysed and sorted to create the data visuals using Infogr.am. Once all visuals were made, I focused on show casing them on a website which was designed and developed by me.
The end result, was exactly what I envisioned with a clean and simple site to let the data visualisations shine and by embedding majority of the data visuals from Infogr.am it allowed it be interactive and functional, which was my end goal.


