
Klarna Data Wall
real-time data visualization
2014
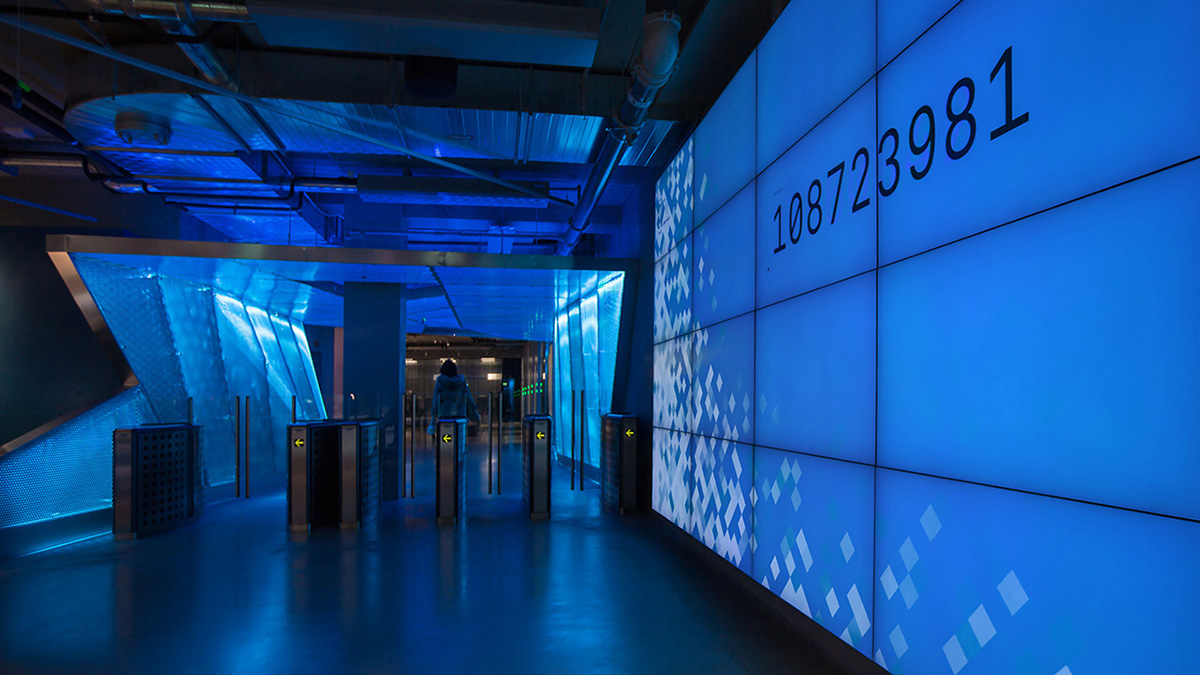
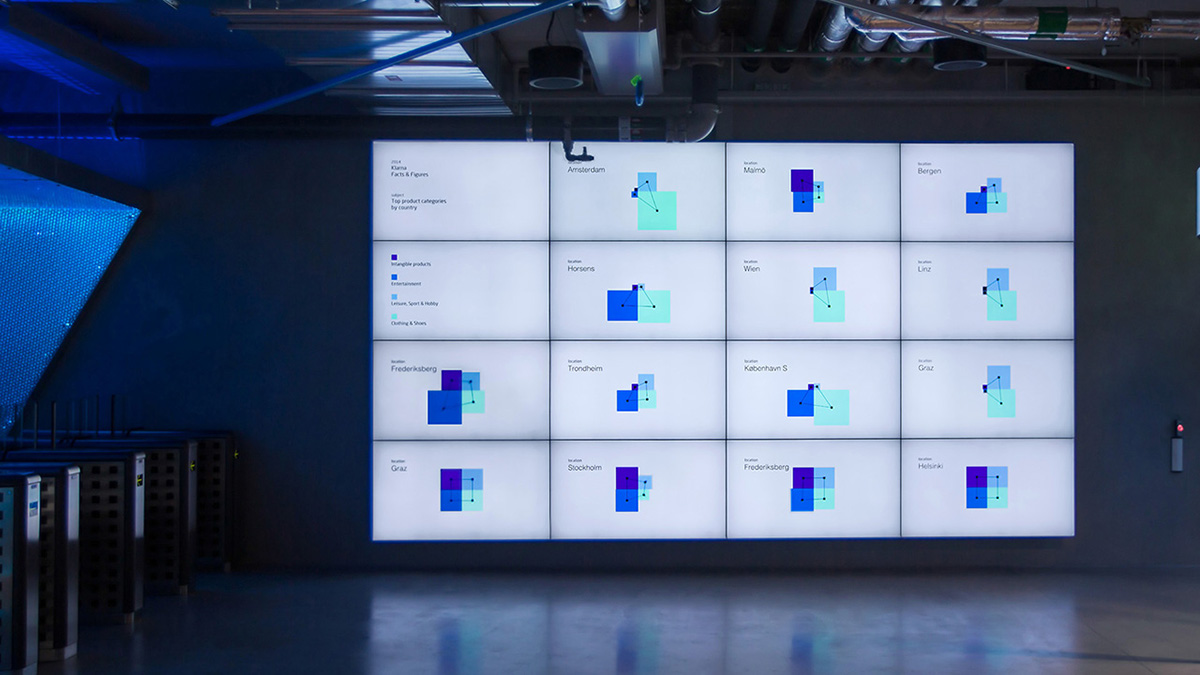
Visualizing their worldwide business activity in real-time, the data wall is the centerpiece of the new headquarters of Stockholm-based payment company Klarna.
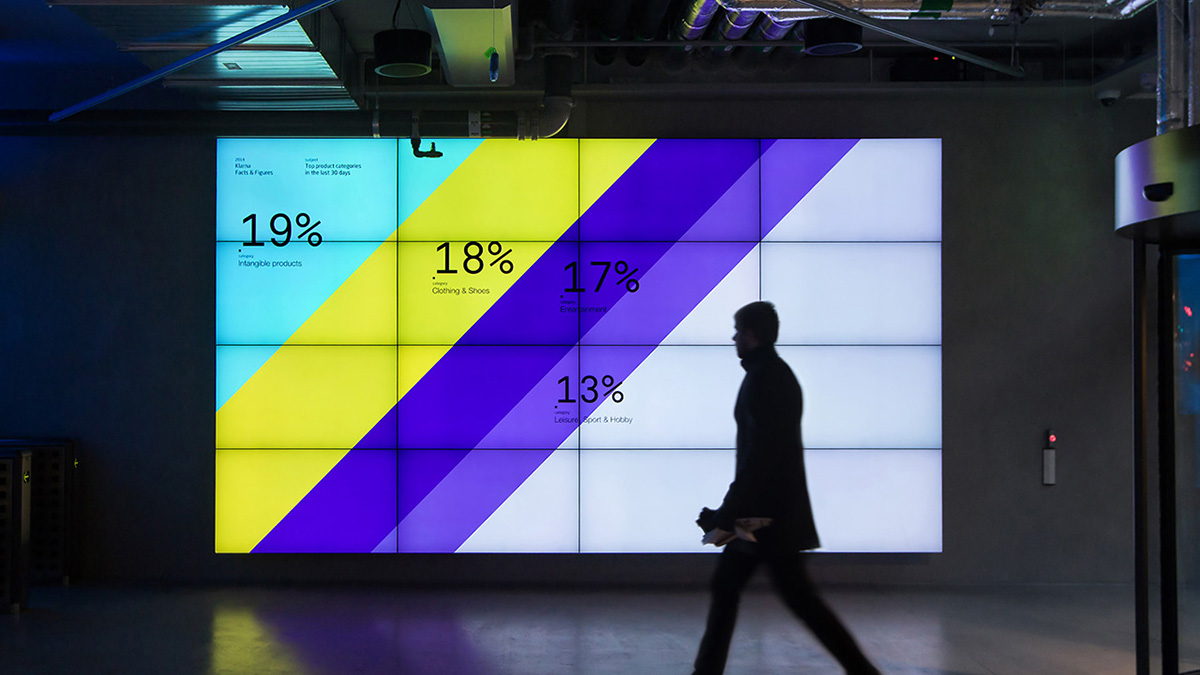
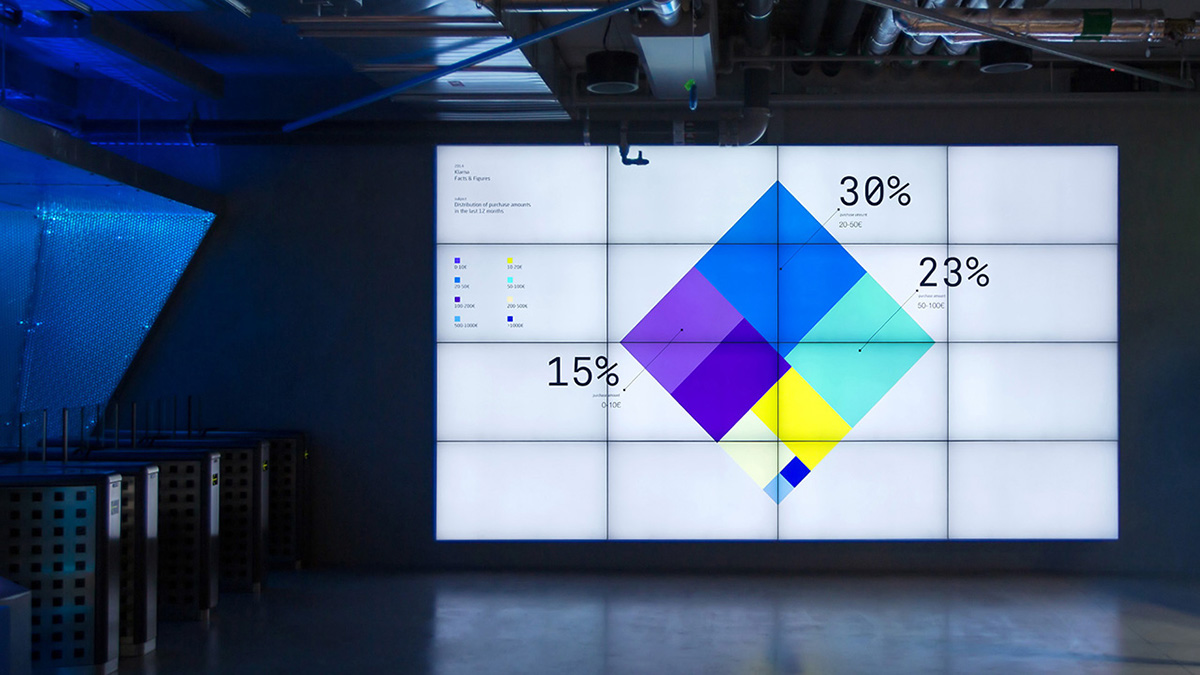
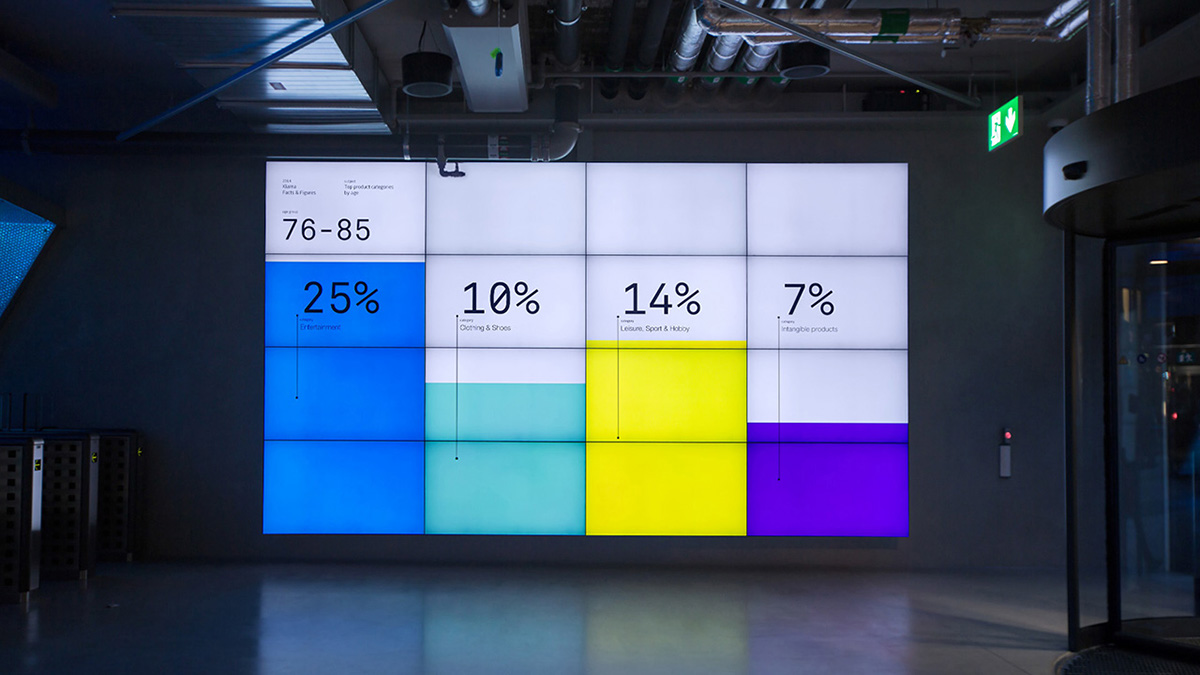
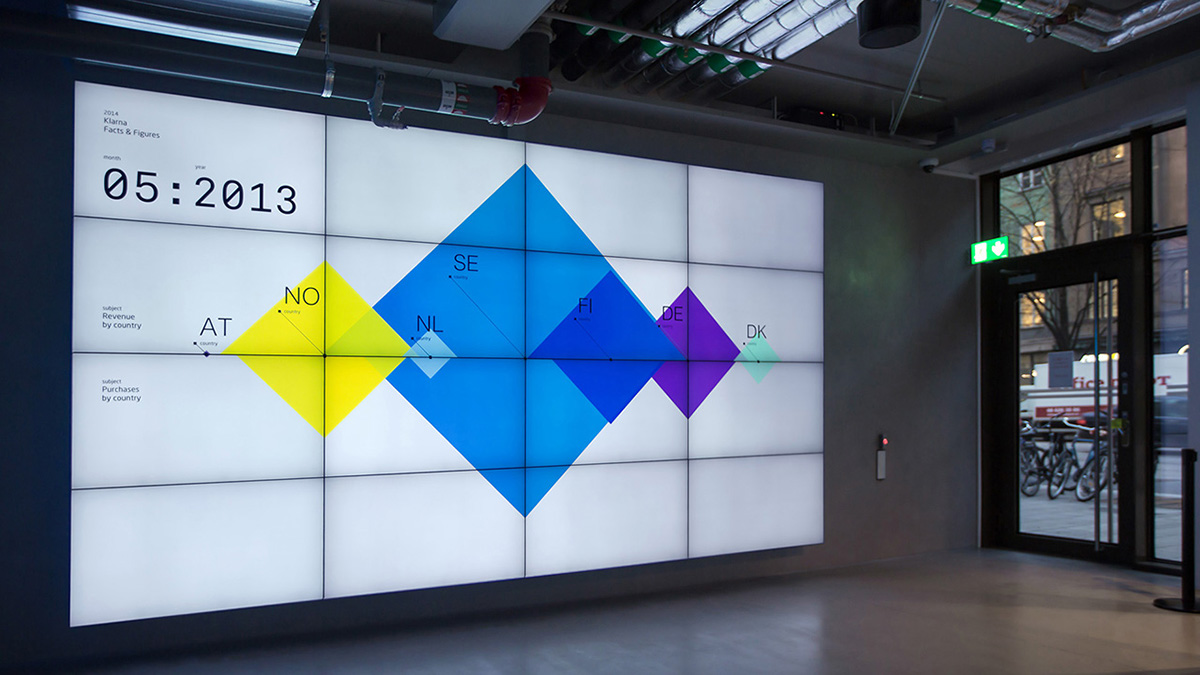
In 2014 Klarna, a leading online payment company from Sweden, approached onformative with the request to develop a real-time data visualization for the lobby of their new headquarters. Based in the center of Stockholm, Klarna currently offers online payment services in 15 countries with over a hundred thousand transactions per day. By analyzing this huge data set, we developed a narrative that visualizes the transactions from a variety of perspectives. Focusing on different aspects such as what, when, where and who, the data wall fluidly transforms into different visualizations.
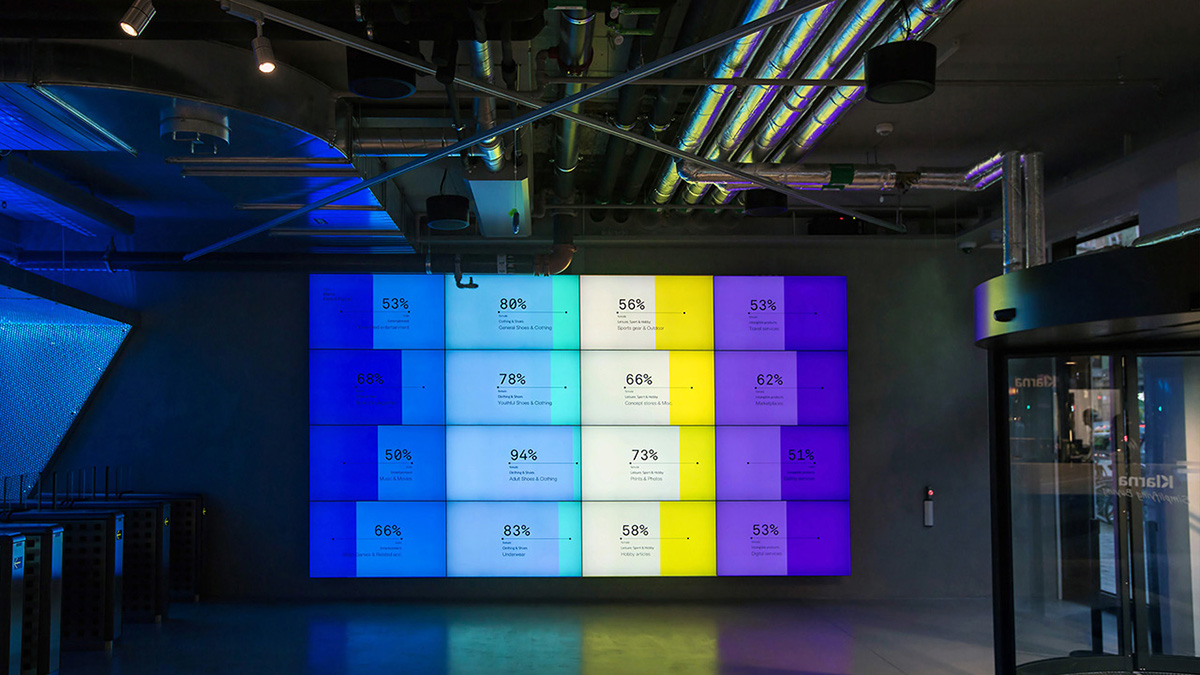
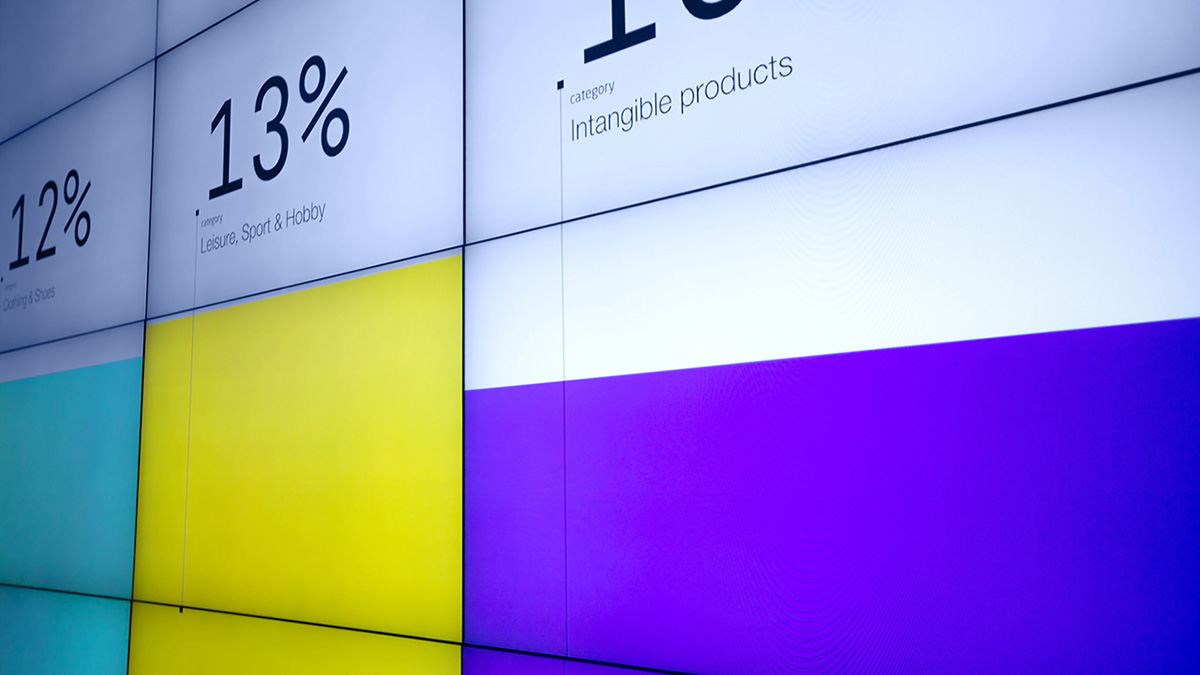
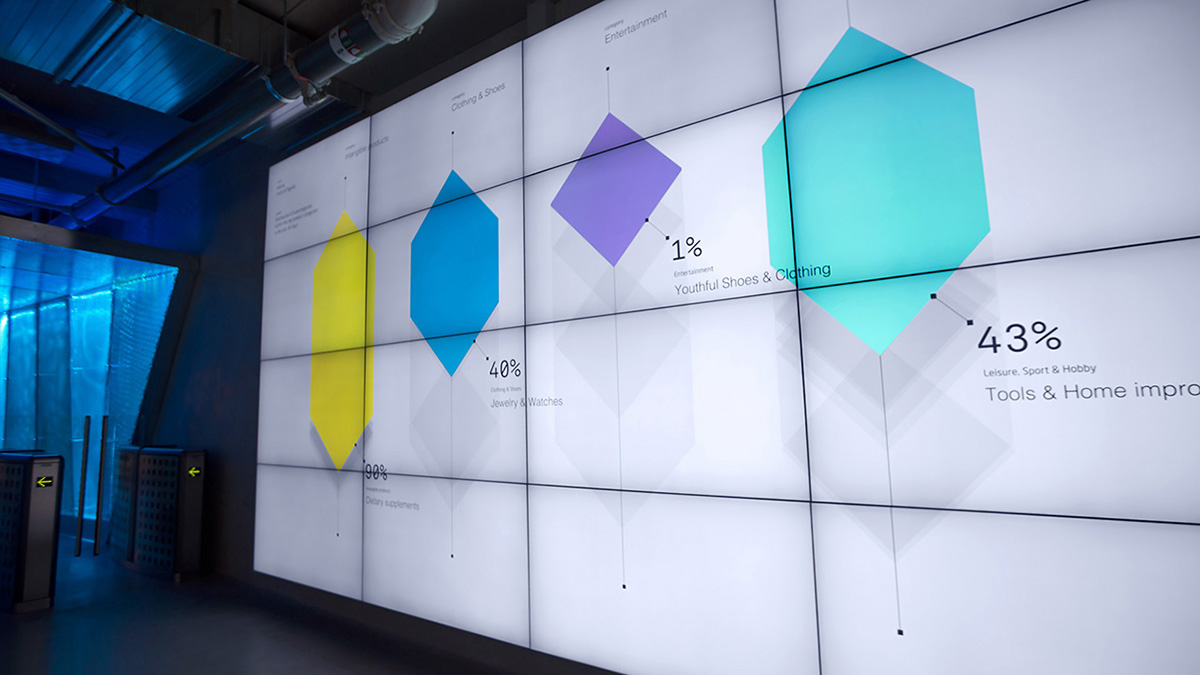
Instead of hiding the characteristics of the 4×4 screen-based media wall, the grid structure became an integral part of the layout used in the design of the various graphs. These represent the volume of transactions sorted by categories and subcategories, the transactions per day, the number of sales by different countries and cities, and the types of purchases made, based on the customer demographics. The data behind these visualizations is continually updated, thereby becoming a real-time representation of Klarna’s business activity.
credits
Commissioned by: Max Larsson von Reybekiel / Klarna
Production: Julia Laub
Creative Direction: Cedric Kiefer
Art Direction: Strichpunkt Berlin
Data Analysis: Christopher Warnow
Code: Aristides Garcia
Production: Julia Laub
Creative Direction: Cedric Kiefer
Art Direction: Strichpunkt Berlin
Data Analysis: Christopher Warnow
Code: Aristides Garcia
awards
ADC Award 2015
Red Dot Design Award 2015
if award 2016
Red Dot Design Award 2015
if award 2016

