What's Really Happening is an informational graphic poster describing a typical female college student lifestyle. The intent of this project was to show the reasons and meanings behind different behavioral characteristics on a day to day basis. The chart covers a time line of a week between Tuesday, January 28th and Monday February 4th, 2014. It includes a sleep schedule, places traveled, time spent with different people, hygiene, food and drink consumption, television programs, and other weekly activities that effect ones emotions.
Data Collection, Organization, Creative Thinking, Composition, Typography, Vector Drawing


Above: The highest emotion on a day to day basis is wildly happy, while the lowest emotion is very upset. The inforgraph shows how activities, places, people, foods, or time can effect daily emotions.
Below: As a typical college student the breaks and colors in the infograph compares the amount of time spent in certain places as well as time traveled.
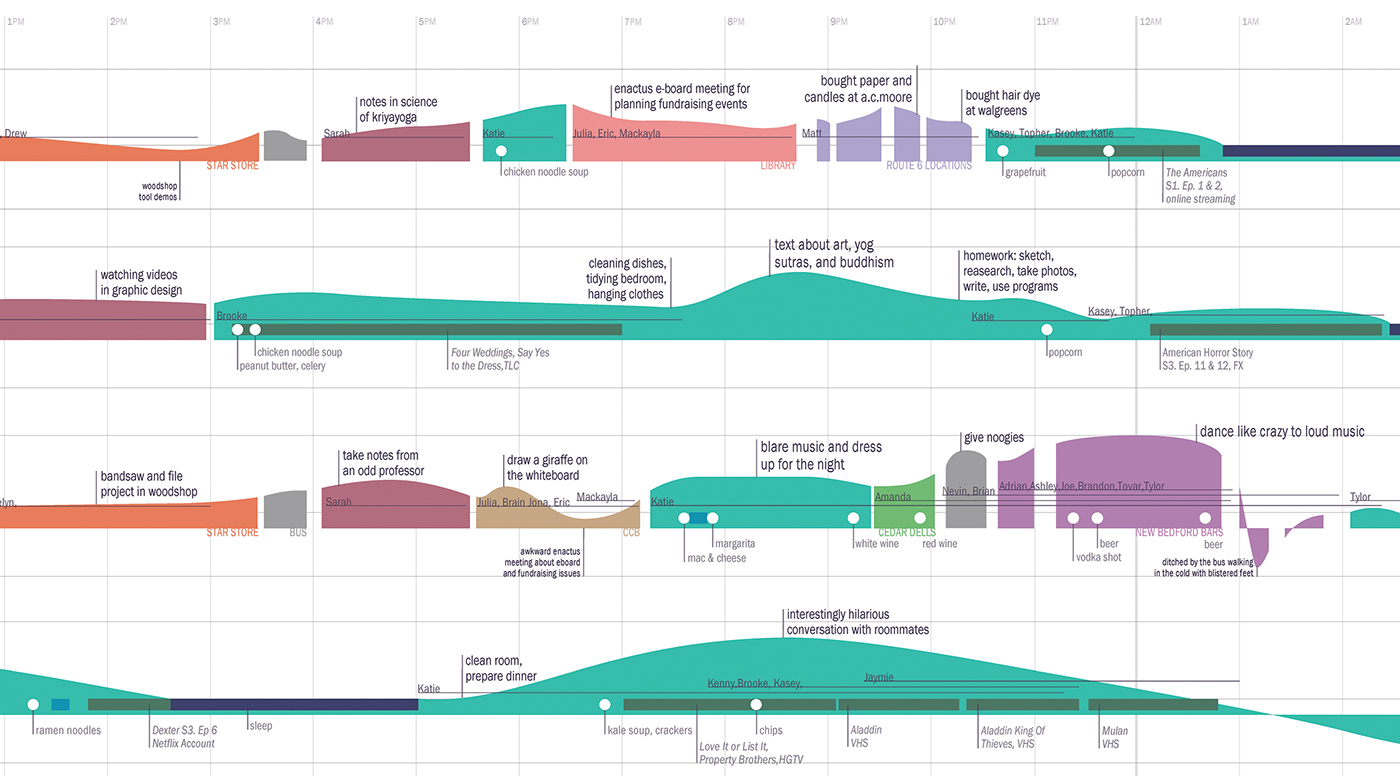


The infograph makes comparisons between busy school days, lazy weekends and spending the night out. Friday was a lazy day, the whole day was spend at at home (teal) and almost half of it consitsted of sleeping (navy).The days to sleep in are clearly Friday through Sunday. The emotions arent as steep as they are thursday and Saturday night when im out and about. And by looking at the breaks in the chart, Tuesdays and Thursdays are the most traveled.

