Introduction
Collaboration and integration have become increasingly imperative within the scientific community as many diverse research teams have formed around the multivariate issues of our time. Because complex questions often require the expertise of many specialties research teams find themselves charged with the additional challenge of integrating large, multi-institutional, multi-disciplinary teams. Concepts such as “integration” and “collaboration” are often ambiguous in definition and diverse in connotation making it difficult for research teams to establish goals and metrics for integration efforts (Tress, Tress & Fry, 2006). While variant, these terms do share a common aim: to define or characterize relationships between different groups and individuals. Social Network Analysis (SNA) is a methodological approach that measures and assess relational patterns across a network of individuals or groups. Research in Network Science has led to the development of a family of metrics, collectively referred to as centrality, that analyze and describe how networks are organized as a whole, and the potential for influence that is afforded by a given position within the network. (Freeman, 1979; Krackhardt, 1994; Wasserman & Faust, 1994; Borgatti, 2003; Stephenson & Zelen, 1989). The REACCH SNA Project aims to understand if and how SNA can be an effective tool to help research teams assess and leverage cross-disciplinary communications, resources and expertise within intellectually diverse and geographically distant research teams by understanding if or how network centrality measures correlate to other team science metrics such as participant’s self-reported perspectives of trust and productivity (Masse et al., 2008; Gajda, 2004; Tress, Tress & Fry, 2006). SNA is a potentially powerful tool because it can quantitatively measures the structure of connection and disconnection across a network. Additionally, SNA may identify key points that serve to connect areas of the network otherwise distanced by specialty or geographic location. Coupling this information with qualitative analyses of the nature of network connections may provide a method of generating feedback that informs the dynamic process of integration and the conversations surrounding collaboration within transdisciplinary initiatives.
Methodology
The REACCH Social Network was compiled from survey data collected by Adam Bond and David Meyer during the REACCH 2013 Annual Meeting. The survey consisted of a list of all REACCH participants, and asked respondents to characterize the nature of their interactions with each individual on a five point scale. This scale was based on previous work by Gajda (2004) and Tress, Tress & Fry (2006). The scale included: (1) Don’t know the person, (2) No Direct Contact: you know who this person is, but do not have direct contact with them, (3) Communication: you have shared information with this person to meet project goals, (4) Collaboration: you have actively worked together to set common goals, realized a shared goal or contributed to collaborative knowledge, or (5) Integrated thinking: you believe there has been a strong integration of ideas, merging of perspectives, and growth of common understanding. These interactions were then mapped in a network diagram where each individual was represented as a node or point and connections with others in the network were represented as a lines or edges, with the strength of the interaction being represented by the line weight. This poster focuses on the Collaboration Network Analysis, which includes only those interaction characterized as collaborative or integrative. The REACCH Social Network Analysis primarily focuses on two centrality measures: Degree Centrality and Betweenness Centrality.
Degree Centrality: Perhaps the most intuitive measure of a node’s influence within a network is that of Degree Centrality. A node’s degree refers to the number of other nodes with which it is directly connected. These nodes are considered potentially influential because it is likely that an individual with a large proportion of direct connections would consider themselves, and be considered by others as an important source of information within the network. Because these individuals are in contact with a large percentage of the network’s communication flow they are often considered to be “in the know” and aware of what is going on within the organization. Nodes with high Degree Centrality are considered central to the network because they not only receive a large portion of information, but also have potential control over information dissemination by generating or transforming much of the information flowing throughout the network. Nodes with many direct connections may be perceived or identified as the formal or informal leaders of the organization.
Betweenness Centrality: Betweenness describes the extent to which an individual or node is between other nodes, that is to what extent a node is directly connected to other nodes which are not directly connected to each other, thereby creating an indirect connection, or bridge, between these other nodes. Betweenness Centrality may indicate a node’s potential influenced based on the premise that the node’s role in connecting other nodes gives it a level of control over information flow. An individual between two nodes may serve as a coordinator of information by maintaining communication paths that connect resources and expertise in different areas of the network. The more nodes within the network that a node is between the higher its Betweenness Centrality measure.

The REACCH Collaboration Network: Degree Centrality & Team Leads visualization shows the degree centrality of project management and team leaders throughout the network. As would be expected, most management and leadership individuals show high degree centrality. In addition to these prescribed leaders a number of project members also show high degree centrality. These individuals may represent the project’s informal leaders—people who may be seen by others as trusted and knowledgeable sources of information. While their potential influence is much harder to quantify, it is possible that individuals with low Degree Centrality may also have an important role to play. These nodes may be characterized by their connections to other communities/networks and resources outside of the network under study, and through these other connections provide the defined network access to diverse perspectives, resources and ideas (Krebs and Holley, 2006).
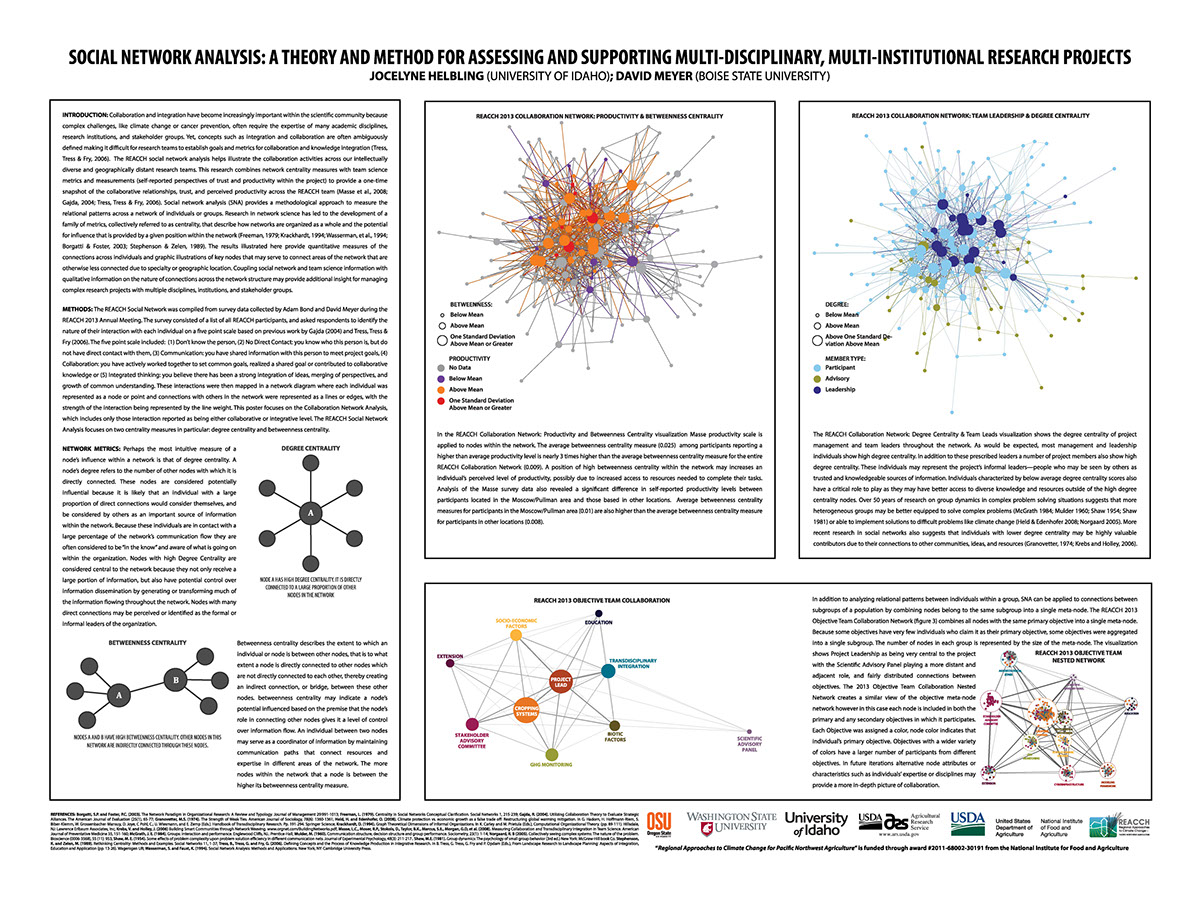
In the REACCH Collaboration Network: Productivity and Betweenness Centrality visualization the Masse productivity scale is applied to nodes within the network. The average Betweenness Centrality measure (0.025) among participants reporting a higher than average productivity level is nearly 3 times higher than the average Betweenness Centrality measure for the entire REACCH Collaboration Network (0.009). A position of high Betweenness Centrality within the network may increases an individual’s perceived level of productivity, possibly due to increased access to resources needed to complete their tasks. Analysis of the Masse survey data also revealed a significant difference in self-reported productivity levels between participants located in the Moscow/Pullman area and those based in other locations. Average Betweenness Centrality measures for participants in the Moscow/Pullman area (0.01) are also higher than the average Betweenness Centrality measure for participants in other locations (0.008).

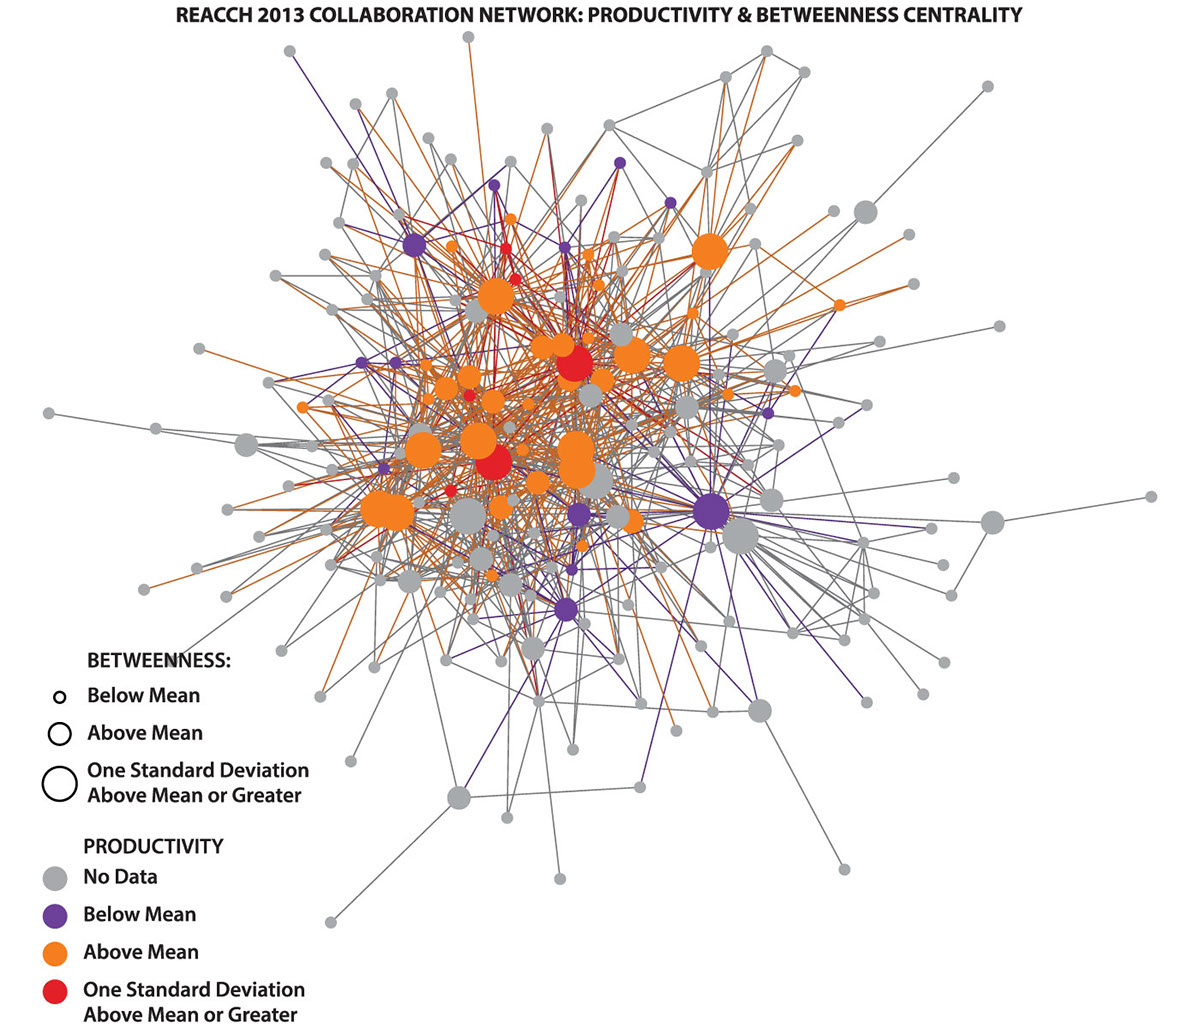
In addition to analyzing relational patterns between individuals within a group, SNA can be applied to connections between subgroups of a population by combining nodes belong to the same subgroup into a single meta-node. The REACCH 2013 Objective Team Collaboration Network combines all nodes with the same primary objective into a single meta-node. Because some objectives have very few individuals who claim it as their primary objective, some objectives were aggregated into a single subgroup. The visualization shows Project Leadership as being very central to the project with the Scientific Advisory Panel playing a more distant and adjacent role, and fairly distributed connections between objectives.
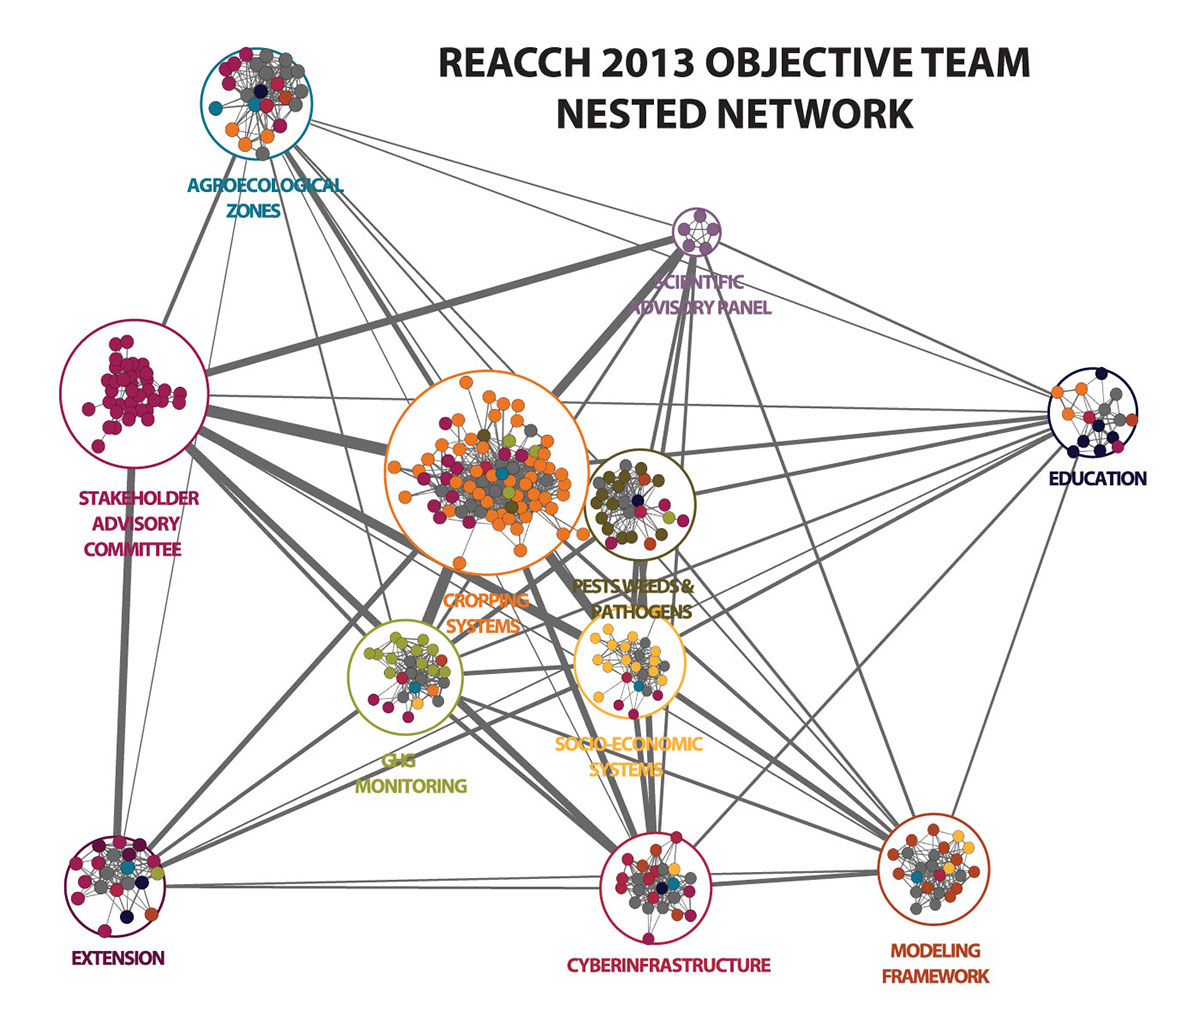
The 2013 Objective Team Collaboration Nested Network creates a similar view of the objective meta-node network however in this case each node is included in both the primary and any secondary objectives in which it participates. Each Objective was assigned a color, node color indicates that individual’s primary objective. Objectives with a wider variety of colors have a larger number of participants from different objectives. In future iterations alternative node attributes or characteristics such as individuals’ expertise or disciplines may provide a more in-depth picture of collaboration.