ABOUT THIS PROJECT
The goal was to create a new business intelligence portal that will deliver a dashboard experience that will allow authenticated users to manage a collection of purchased products. Users can also review available products which could be purchased. Unauthenticated users will be presented with a marketing page which will provide options to learn more about various company capabilities. My role included user research, product research, information architecture, as well as functional and visual design.
RESEARCH
As I was thinking about the user-centered design process, I met regularly with the stakeholders to understand how they intended to promote the products and who the main users were. I found that a high percentage of the users would ikely be using tablets in their work environment, while others would be using a smart phone or desktop. These findings helped us convince the stakeholders to invest efforts into utilizing responsive design techniques.
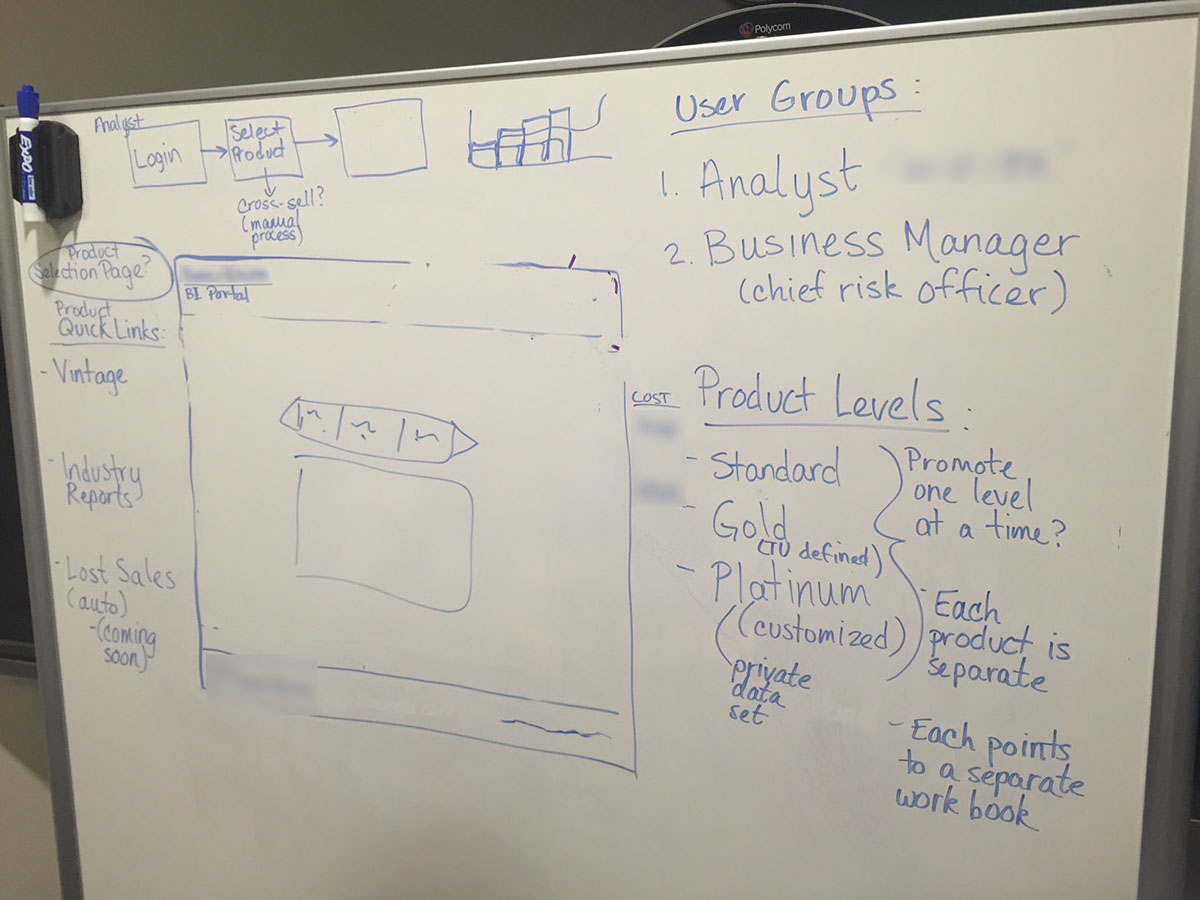
We held initial whiteboard sessions to start carving out a high-level design. This helped us determine where, and how, this new Business Intelligence (BI) Portal would fit into other existing product solutions.

Several whiteboard sessions helped to create a more refined strategy and allowed me to start the creation of user and process flows. These flows were valuable inputs for building the product options and confirming user goals.
Now that I knew about the intended features, I prepared site maps.

...and also user stories.

PROTOTYPING AND DESIGN
With the information architecture in place, and a solid site map, I was able to start wireframe prototype activities. For this project, we were designing with material design (or flat design) in mind. Similar to how I was seeking continuous feedback from the stakeholders earlier in the project, I solicited many interations of the mockups to be sure we were meeting their requests.


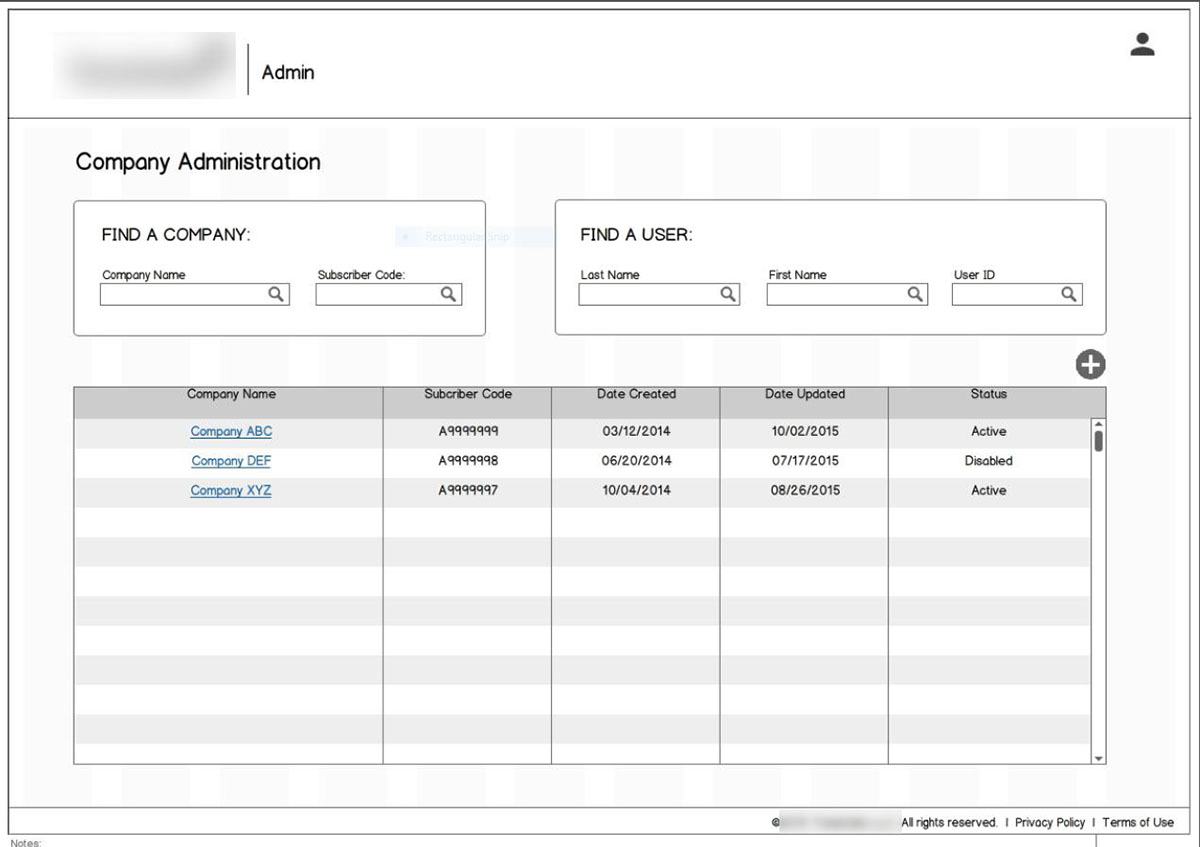
In order to manage users (add, remove, grant priviledges) and products, we were also called upon to design an Administration application, which would be available only for authorized users.
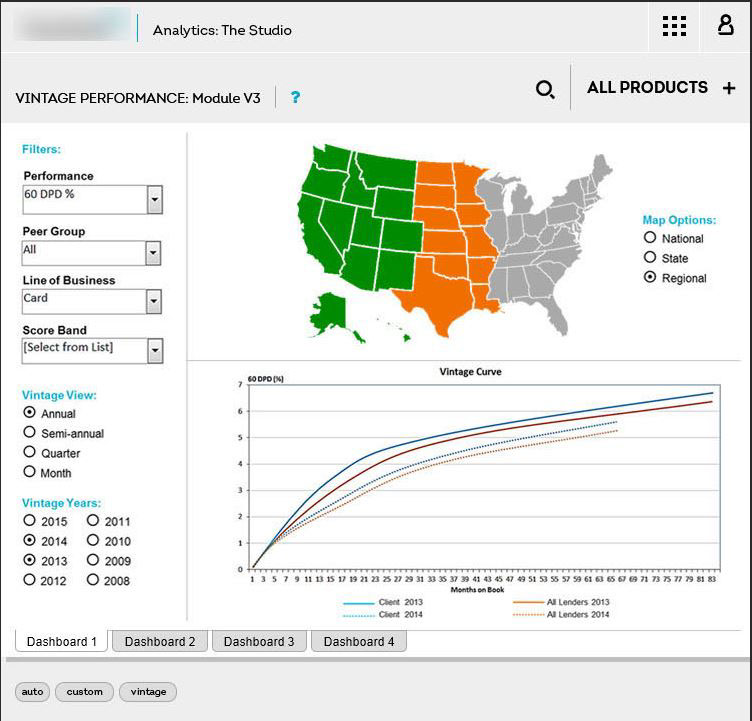
HIGH-FIDELITY MOCKUPS
Once the designs were approved, basic templates were built, following our brand guidelines. Handoff was then performed as the mockups were delivered to the programming team to build the functioning portal. As the pages were being built, I continued to validate that the intended design and functionality were being followed.
RESULTS
The stakeholders were thrilled about the design which provided ease of use and allows for future expansion.
Various device designs are represented.