

A collection of infographics, data-visualisations and social media graphic-templates
I have designed to complement news articles and report events:
I have designed to complement news articles and report events:
EuronewsNBC
A snippet of my responsive interactive Syrian Civil War timeline, which I created using
HTML, CSS and JavaScript, and linked to a Google Spreadsheet where its data was stored:
HTML, CSS and JavaScript, and linked to a Google Spreadsheet where its data was stored:


Reach PLC
Made with HTML, CSS, JavaScript, jQuery, and CARTO's API


A responsive interactive crime map of Glasgow, Scotland, for Glasgow Live (glasgowlive.co.uk)
Made with HTML, CSS, JavaScript, jQuery, and Leaflet and CARTO's API

Cambridge 105 Radio


My own stuff


My Donald Trump word cloud also appeared in British newspaper The Independent: https://bit.ly/2IIKJCS
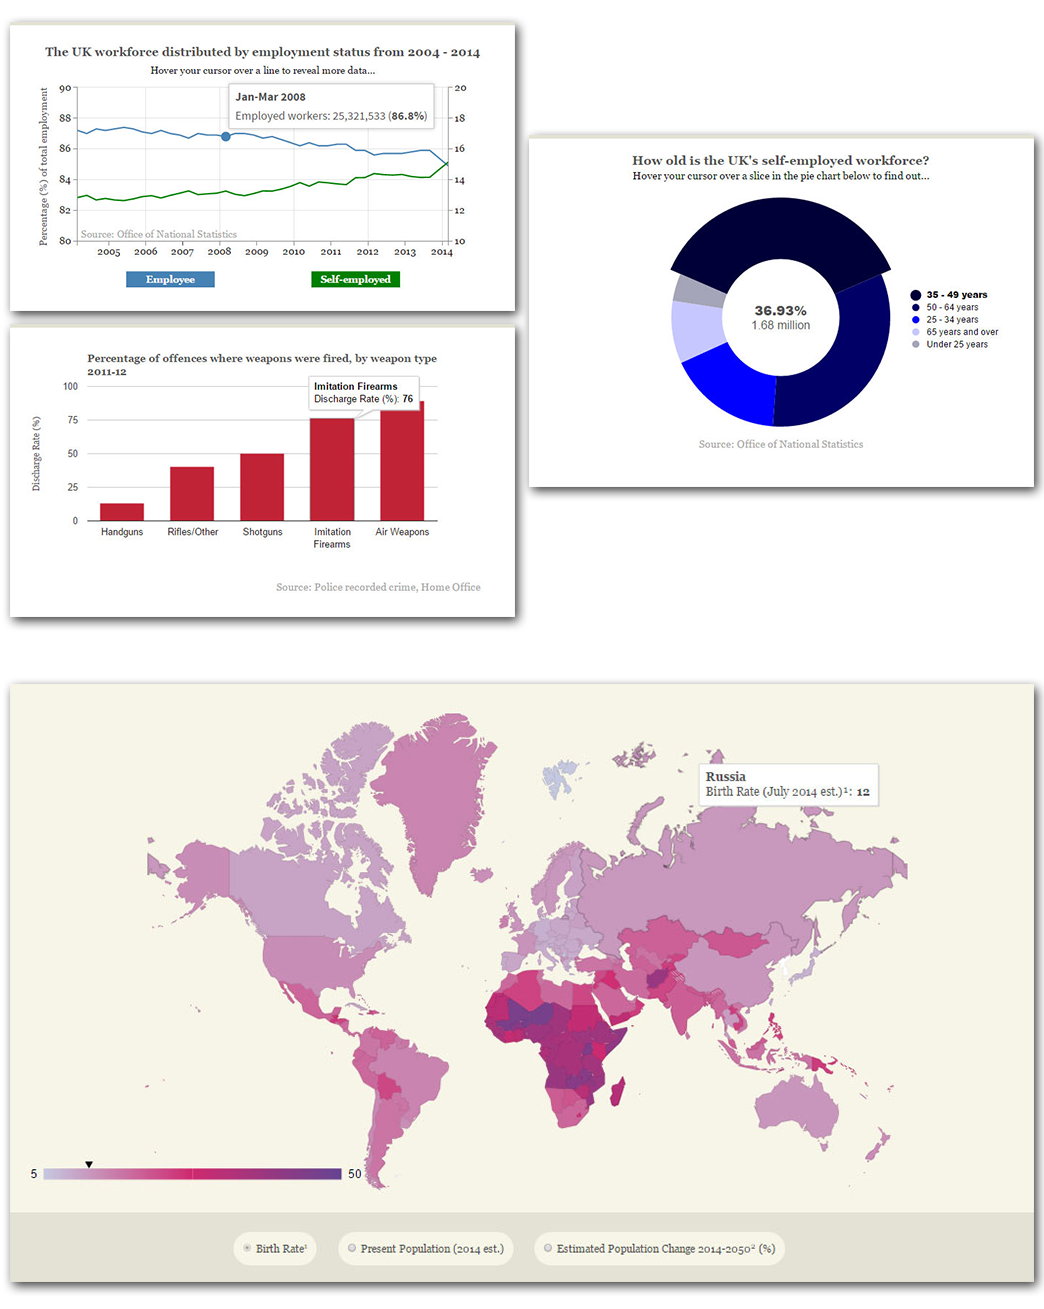
Interactive data-visualisations created using HTML, CSS, Javascript, jQuery, and D3.js, RaphaelJS and the Google Chart API
They can be accessed here:
http://www.sallynicholls.net/sinister-surge-self-employment/
http://www.sallynicholls.net/air-guns-legal-prolific-dangerous/
http://www.sallynicholls.net/data-visualisation-baby-booms-busts/
http://www.sallynicholls.net/sinister-surge-self-employment/
http://www.sallynicholls.net/air-guns-legal-prolific-dangerous/
http://www.sallynicholls.net/data-visualisation-baby-booms-busts/


