Tangible Data Visualization System
June 2015
Large-scale use of office tools and statistical analysis applications indicates that they have sufficed well for some of the everyday tasks in our work cycles such as analysis, presentation, reporting, and decision-making. Nevertheless, they were designed in an era when the business data was not ”big” and complex enough. An ever-growing avalanche of the data that we collect for our businesses compels us to find new means to understand, share, and report the underlying ideas, and to make decisions for the future.
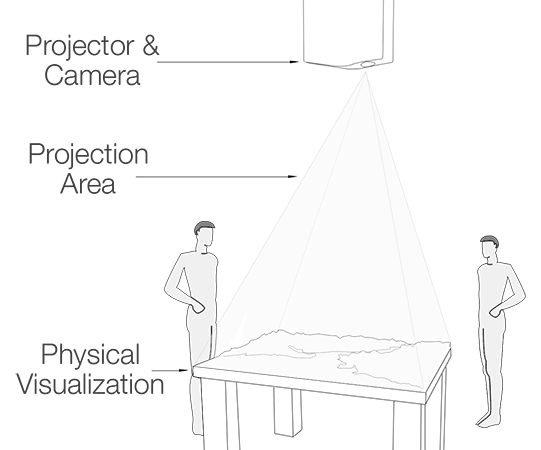
We implemented a tabletop hybrid visual analytics system comprised of projection and physical visualization with the aim of supporting these tasks better by making the data physically available. We conducted a case study with an analysis team of a nationwide bank and made a series of observations and interviews during their data analysis and decision-making sessions. Our study revealed that the hybrid visual analytics system approach promotes idea sharing and contribution of all members of the group during the presentation sessions. It also seems to change the common one-way structure of the communication in the presentation sessions into some other structure that encourages everyone to take the floor. Research questions that will be investigated in the future work are also discussed.
Manufacturing:
We acquired the elevation data of Istanbul from NASA ASTER GDEM v2 since it has the highest resolution elevation data for Turkey. The extent (28.9W-29.1W, 40.95N-41.1N) is selected on purpose because this area of Istanbul has most of the population of residents and the industry, and also most datasets are focused on this central part of the city.

Contour map of raw elevation data (on the left) and the processed data (on the right)
Once we had the data ready, we proceeded with the manufacturing process. Since the dimensions of the physical map are quite large (1.5m x 1.0m), the first option of manufacturing, which is 3D printing, failed to be a feasible solution. Cost and time of the production were high. Opting out that technique, we then faced to CNC printing and found one producer who can manufacture such a system.
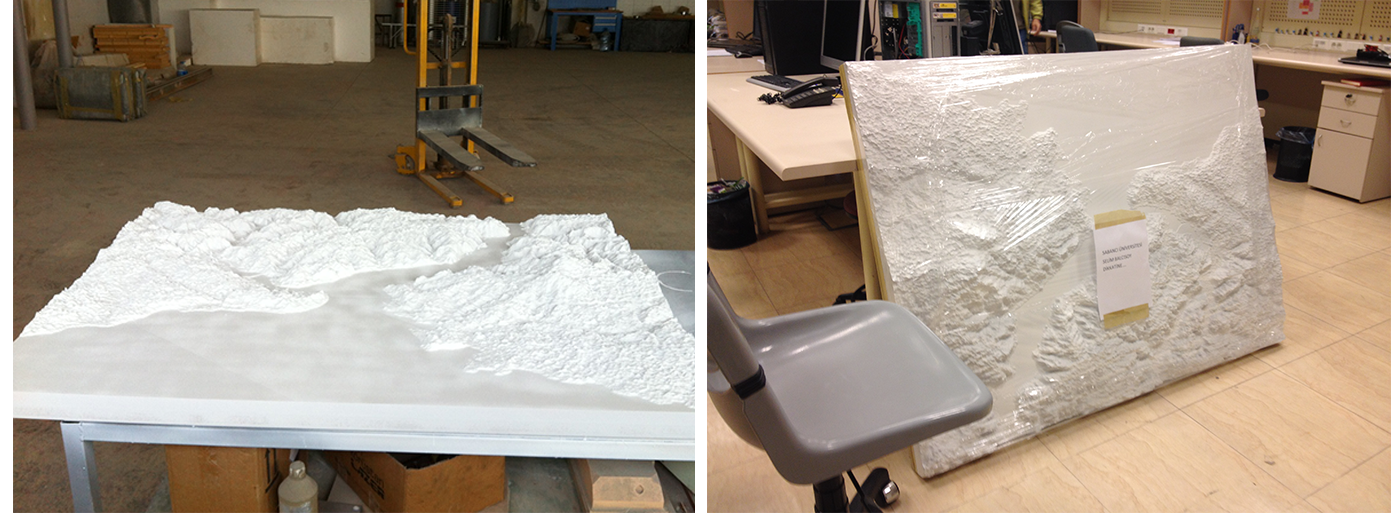
After the manufacturing in the factory (on the left), delivery to the lab (on the right), and placement figure (below)
Software Development:
Immediately after delivery of topographic map to the lab, I started working on the visualization software. First, we needed the base shapes such as shoreline, neighborhoods, and roads. Rather than using raster images, these types of base shapes are extracted from OpenStreetMap by parsing their format and converting it to OpenGL units. Since most these shapes are all concave polygons by their nature, the first problem I had to solve was to triangulate everything.

Triangulation of Kadıköy neighbourhood
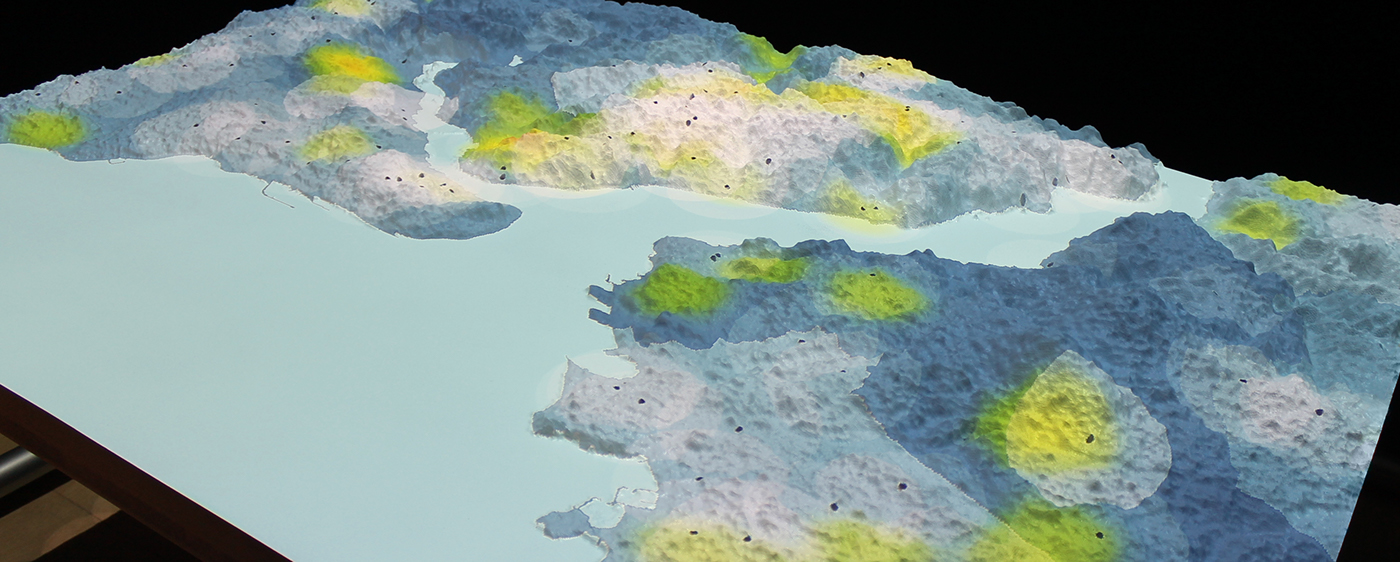
When base shapes are set up and calibrated considering the height of the corresponding pixel, I started on the visualization of the dataset. The dataset contains over 4 million transactions of 400.000 anonymous users spanning three months period from April to June 2013, and it is donated by one of the major banks in Turkey. The spatial transactions split up 1-hour, 2-hours, or 24-hours temporal intervals to feed heatmap algorithm. Then the branches of the same bank are displayed as black dots with their catchment areas displayed as transparent white circles around.

For the control of these visualizations and analysis, we adopted Microsoft Kinect for our purposes and developed two main interactions. The left arm's vertical movement changes the size of catchment areas, and thus the statistics displayed. The horizontal swipe movement of hands jumps the pink circle to another branch to investigate that branch. Other than these, we have another supplementary interaction for turning on and off the natural interactions with Kinect.
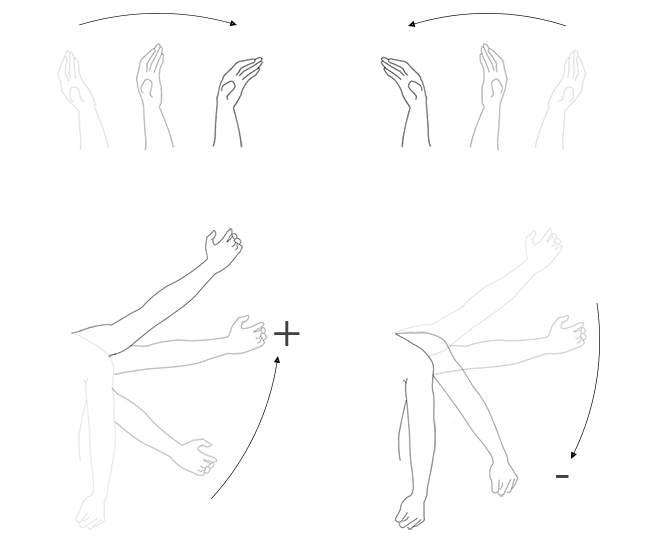
Major Kinect interactions: swiping (above) and raising left hand (below).
Supplementary submission of business|vis|2015 workshop.

