The assignment was to track something for a period of time and in the end vizualize our data in some way. I chose to do a more experimental project and track how much I think about sex for 10 days. I wrote the dates, when during the day the thought occured, what level it was (quick thought, daydream/fantasy or dream), what triggered the thought and also where I was when I thought about it.
Since the project was so short I didn't get enough data to notice a specific pattern, my thoughts were mostly random. So I tried to vizualize it in a way that shows the diverstiy.
Since the project was so short I didn't get enough data to notice a specific pattern, my thoughts were mostly random. So I tried to vizualize it in a way that shows the diverstiy.


What triggered my thoughts

The locations
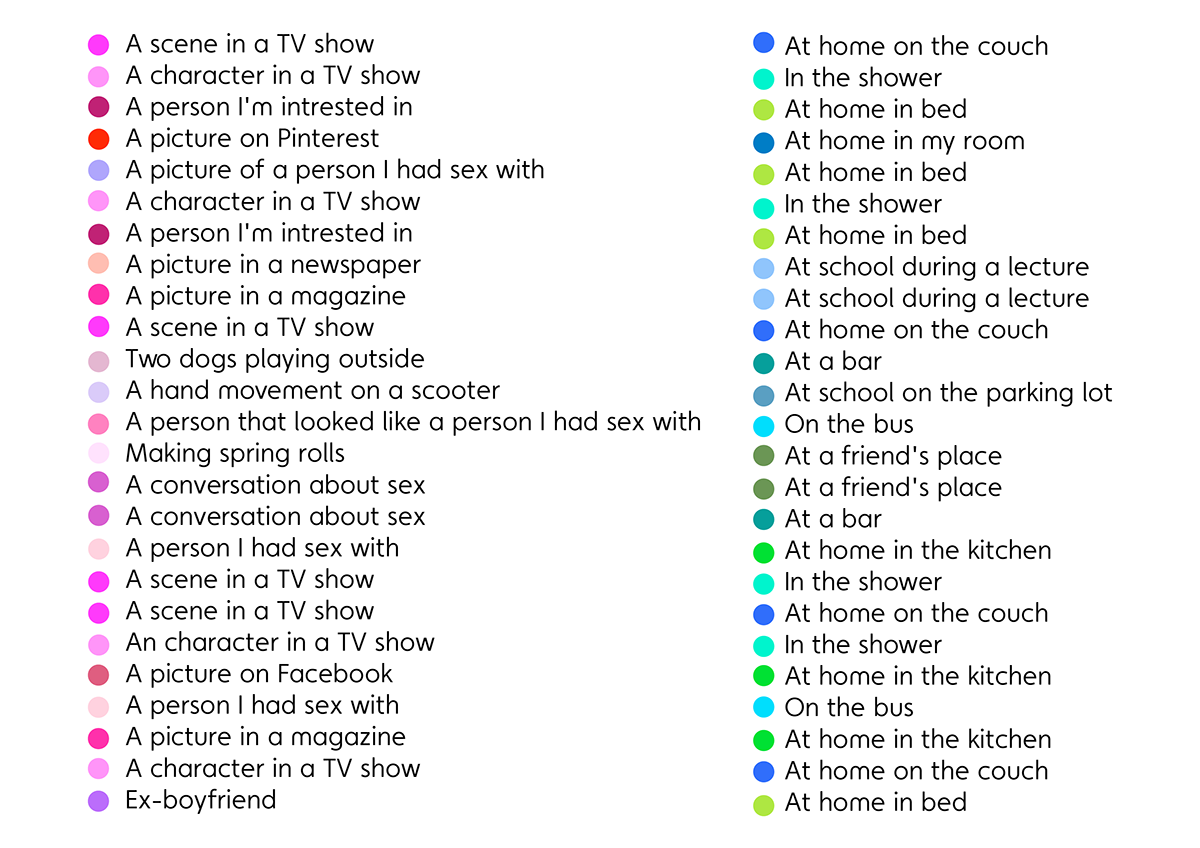

Shows what triggered most of the thoughts and which locations they occured at. The size of the circles indicate how many thoughts are connected to them.

This also shows what triggered the thoughts and the locations, but also the timeline from the 7th to the 16th. The circles at the top are the thoughts that occured at AM and the ones at the bottom were at PM.