
Institutional Design Frontiers 2015—a conference for the Michael Crow initiative to redesign how not-for-profit universities grow in the 21st Century—asked me to bring my design thinking to the table. My workshop trained academics from all over the world who attended the conference how to think about their research graphically in order to communicate more clearly with the public. Their papers, many numbering over 20 pages each, were examined, the high-level concepts pulled out and I spent the afternoon training these deep thinkers how to use their creativity to express the most important parts of their research. The following images are from this experience.


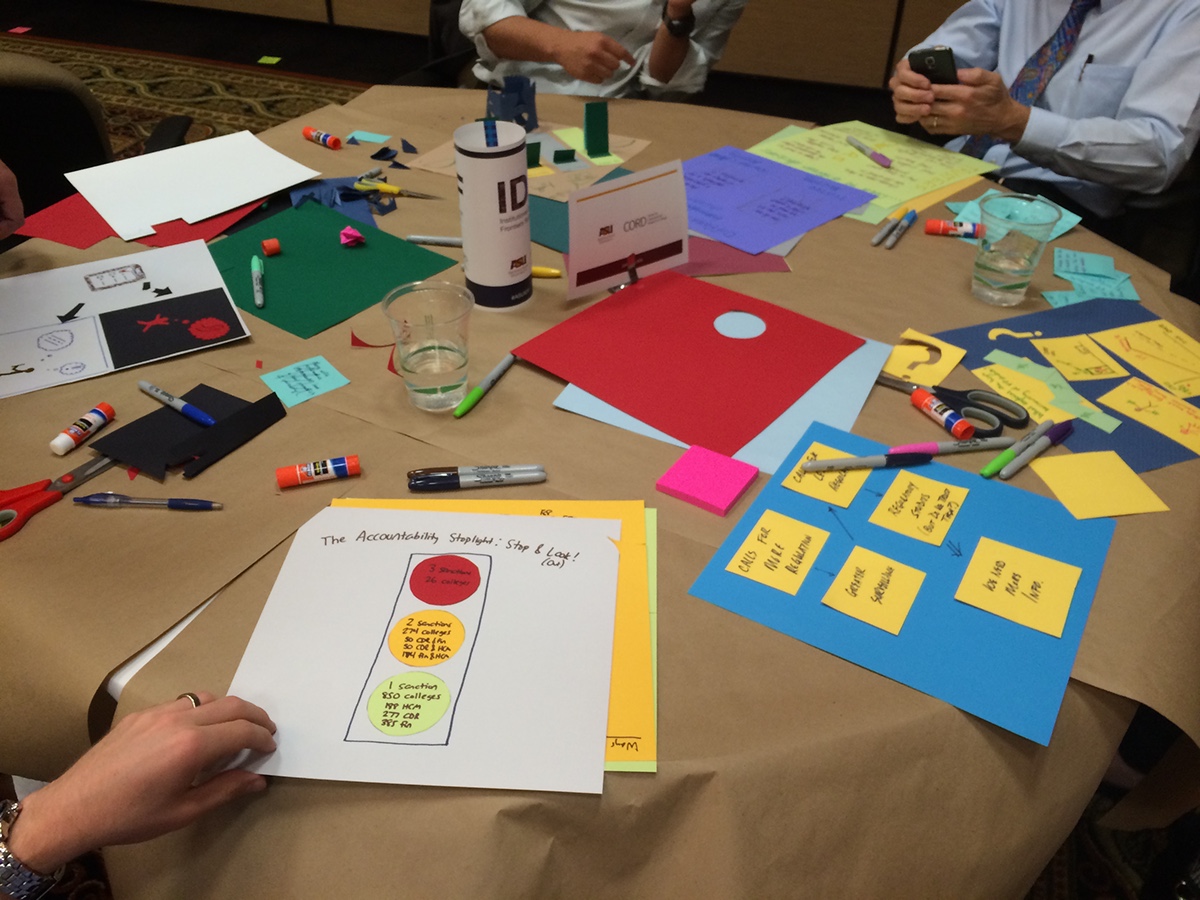


Many of the PhDs had never done work like this before and they immediately embraced this form of communication with gusto. A few even created 3D models of their ideas and all walked away with new skills in expressing their work.
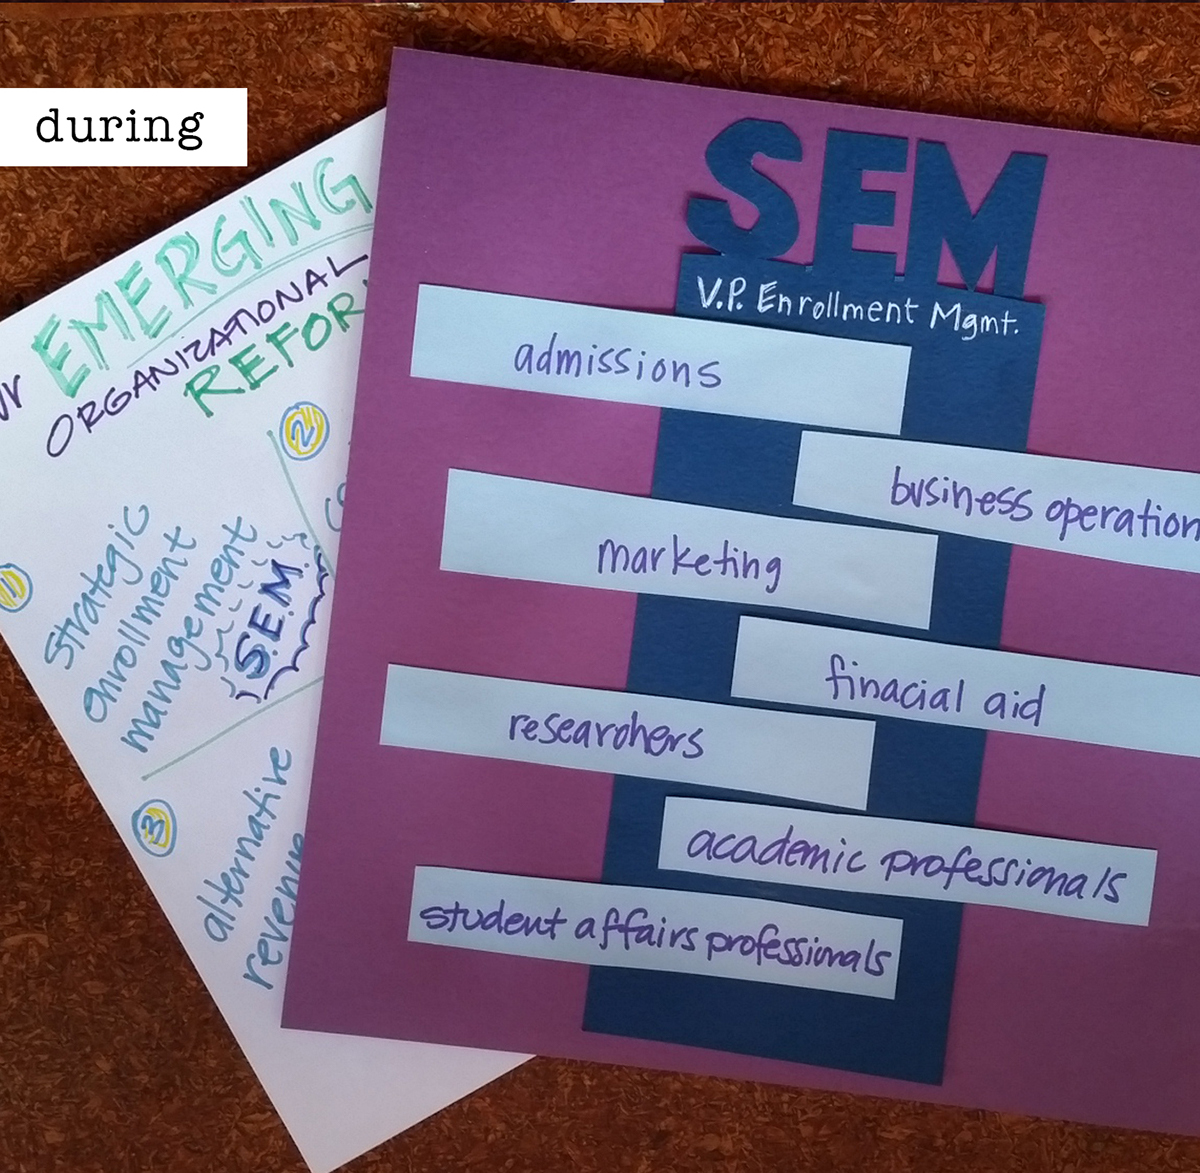
The final part to this conference workshop was to recreate the academics' creativity into professionally designed infographics. The infographics were digitally designed then sent to the participants for their use as they applied to publications. One example is below.

