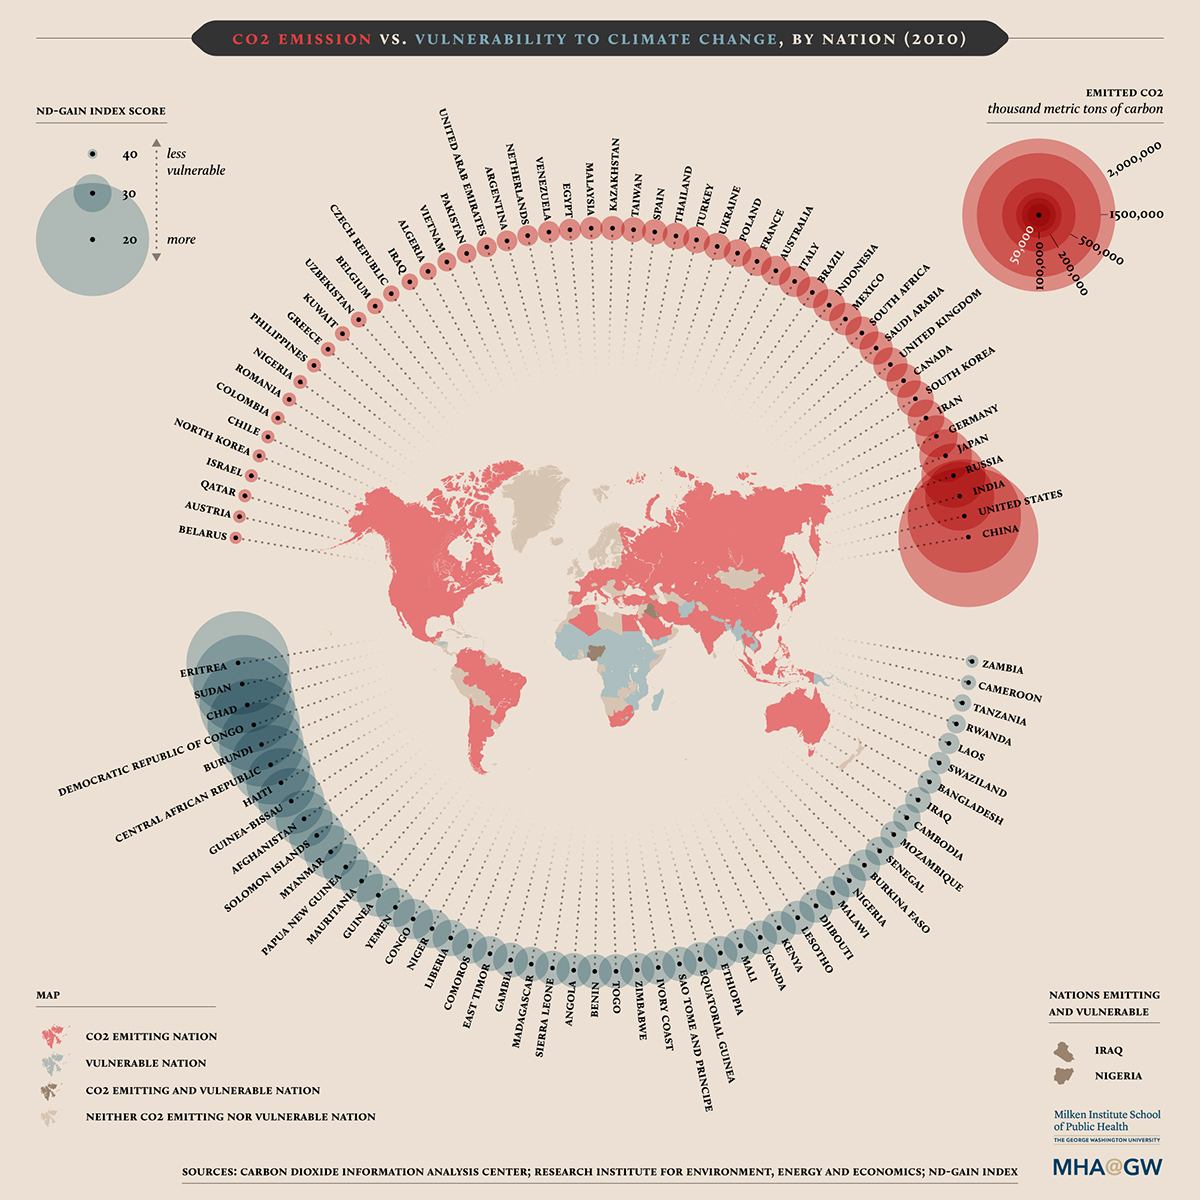
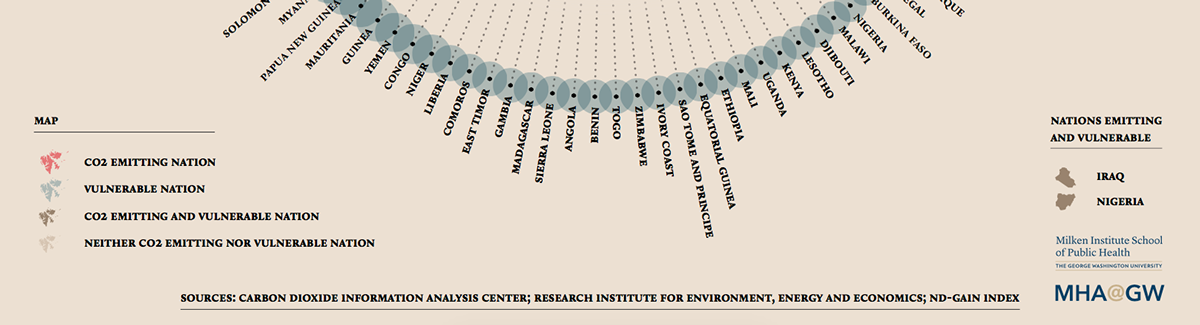
CO2 EMISSION VS. VULNERABILITY TO CLIMATE CHANGE, BY NATION (2010)
Artwork designed for 2U Inc. and Milken Institute School of Public Health at the George Washington University regarding climate change. In the upper semicircle it is possible to observe the nations that emit CO2 the most (each circle is sized on the basis CO2 emissions in tons) and in the lower the climate change most vulnerable nations (each circle represents the value in 'ND GAIN Index').