EDM Audience Analysis
DATA VISUALIZATION / LAYOUT DESIGN / ICONOGRAPHY
The data visuals are based on what EDM fans and what general music lovers discuss on social. Once a decision was made to create the drivers of conversation as donut charts, the idea came to make the graphs as if they were records, spinning as we broke down the sections on their own pages.

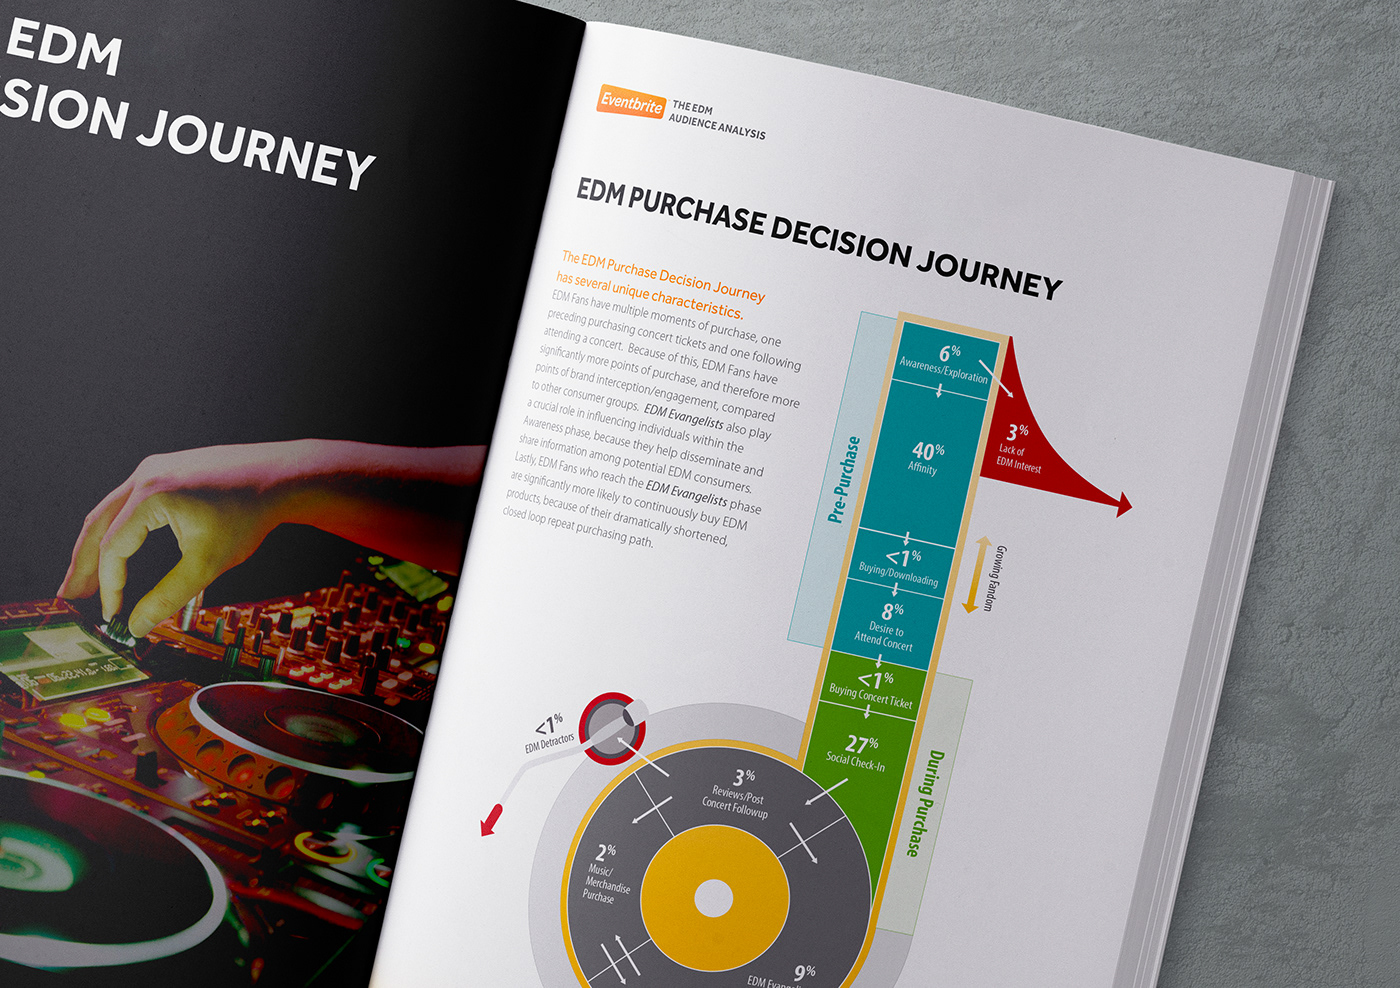
The second section contains the most important data of all: a purchase decision journey of EDM fans. Each decision journey is unique to the subject matter. Once it was figured out that post-purchase cycles back into itself, drawing it out revealed that it took the shape of a music note coincidentally.