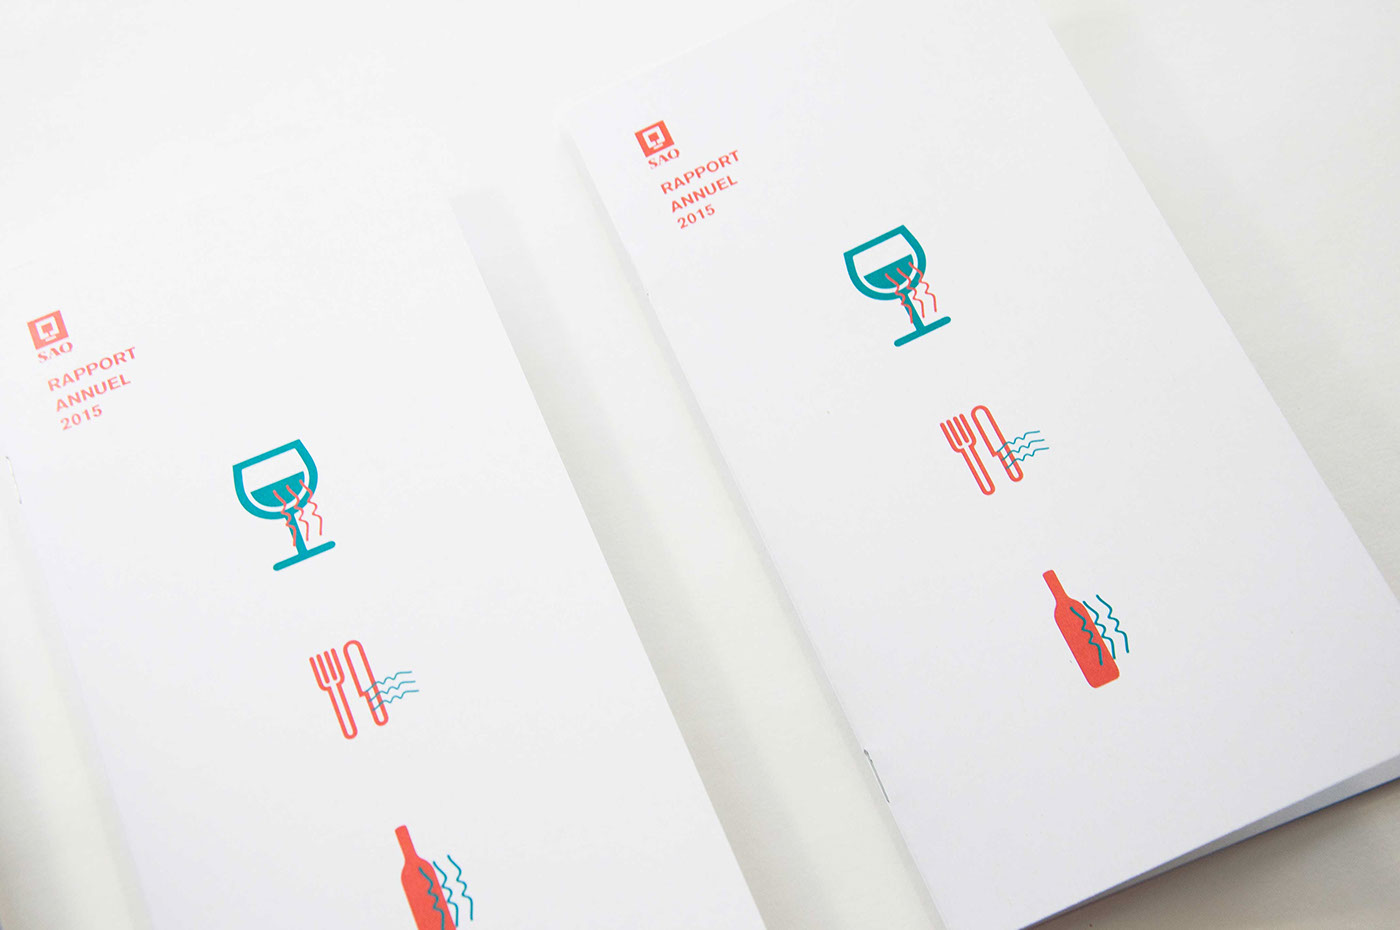
The purpose was to create a concept around the report and not just do a cute little report.
So I made it a concept, the waves that you see in this report is a schematization of alcohol.
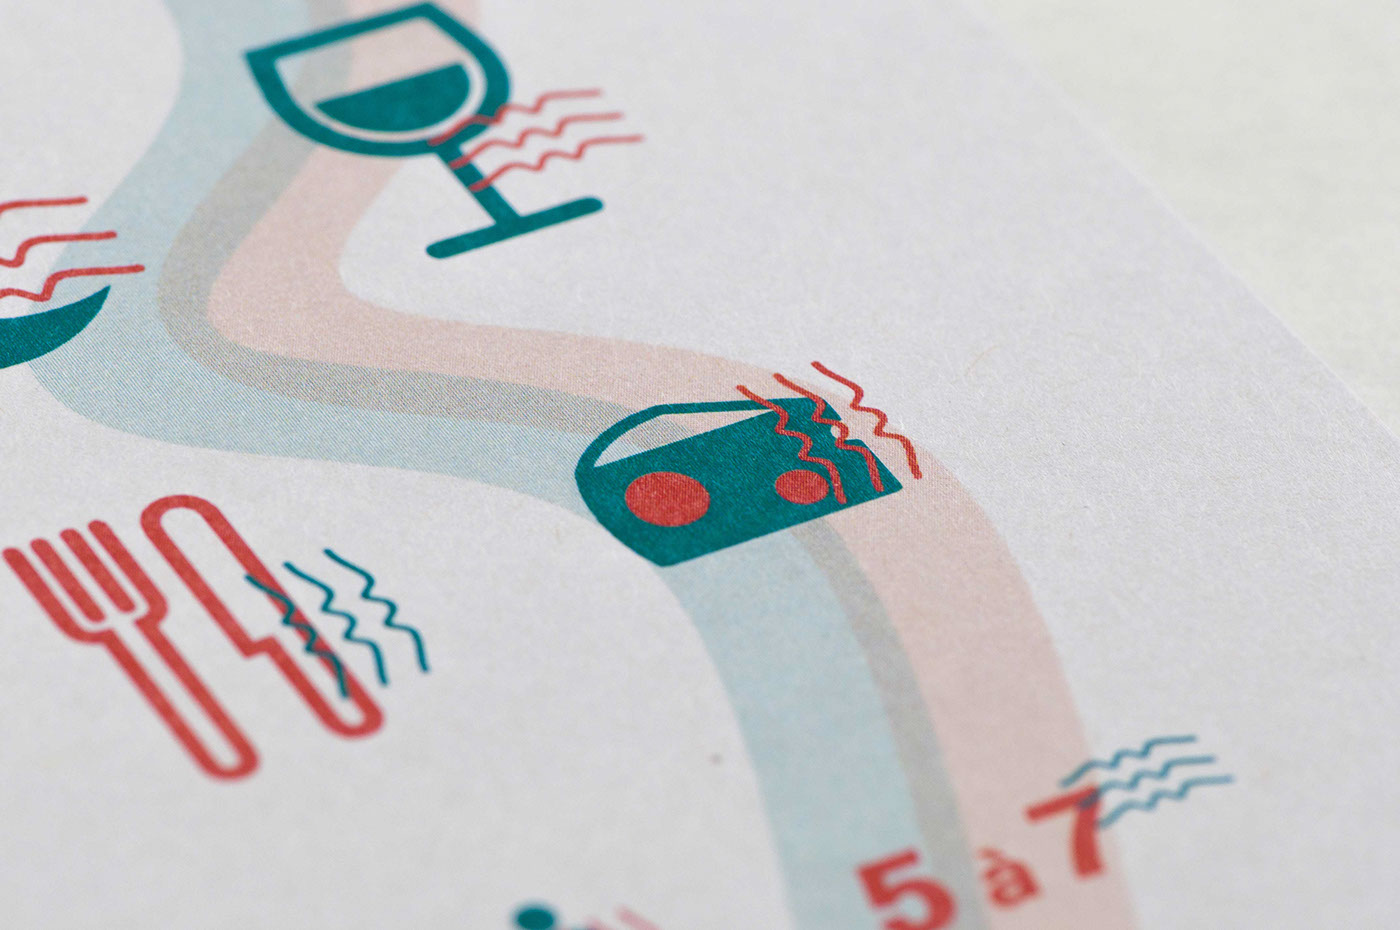
Every pictogram you see is every moment that you're favorable to drink alcohol.
This is a fictitious project that I've made as a student.