

Overview
This project was one of the fastest projects completed within the set timeframe with super-positive results. The startup is GripQA and I worked directly with the CEO and founder Jan Princen and their lead dev Abbe with regular calls.
The platform, although extermely informational, was numbers and forever scrolling. We improvised through UX and data visualization. The time difference between Amstedam and Auckland worked to our advantage and the project was completed on time.
Project Timeframe
The initial timeframe (a 1 week sprint) was decided based on the screens for one user segment.
The initial timeframe (a 1 week sprint) was decided based on the screens for one user segment.

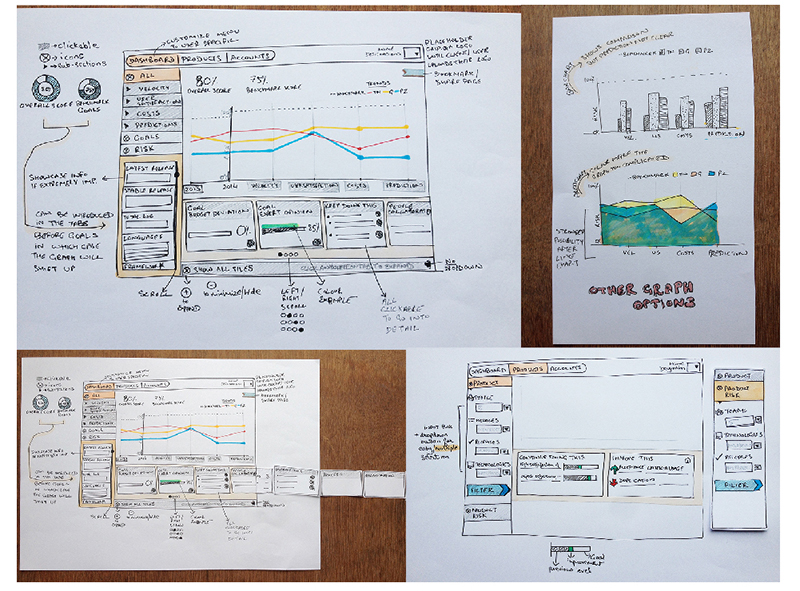
Sketches
These were some of the sketches done on the first day after the call. The shots were put into a pdf to show step-by-step interaction with changed information. There are lot & lots more sketches, but they have more detail hence cannot be shown.
Pre-Conditions
A few preconditions were set that had to be complied with, like the user mush have access to the portal.
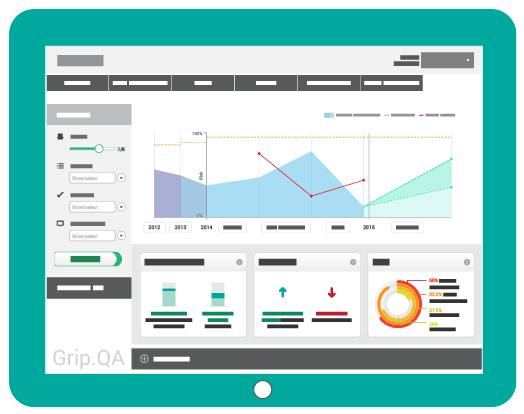
Wireframes
Although the initial scope was for a single viewer segment dashboard, we made alterations and changes to make the content consistent for the rest of the users as well. So as you see, we have the CEO/CIO level view which is most complex and intertesting, then Managers' view, and lastly an individuals' view.

So now, lets go from the simplest to the simple.
: An individuals' view
: Manager's Dashboard

: CEO/CIO level view (the information displayed is more in context to the organization and the portfolio section is the one that's seemed to be most beneficial)


