F M P - I N F O G R A P H I C S
Infographic A1 posters - 20 days of troll hunting
"This series of posters visually interpret a survey I conducted concerning online trolls, aka cyber bullying. The survey took place in the period of 29.01.2015 – 17.02.2015, and five Norwegian bloggers were the victims. Using an article about different types of troll, from Buzzfeed.com, the trolls have been analyzed and divided into different categories systematically, from good to bad. "

1.
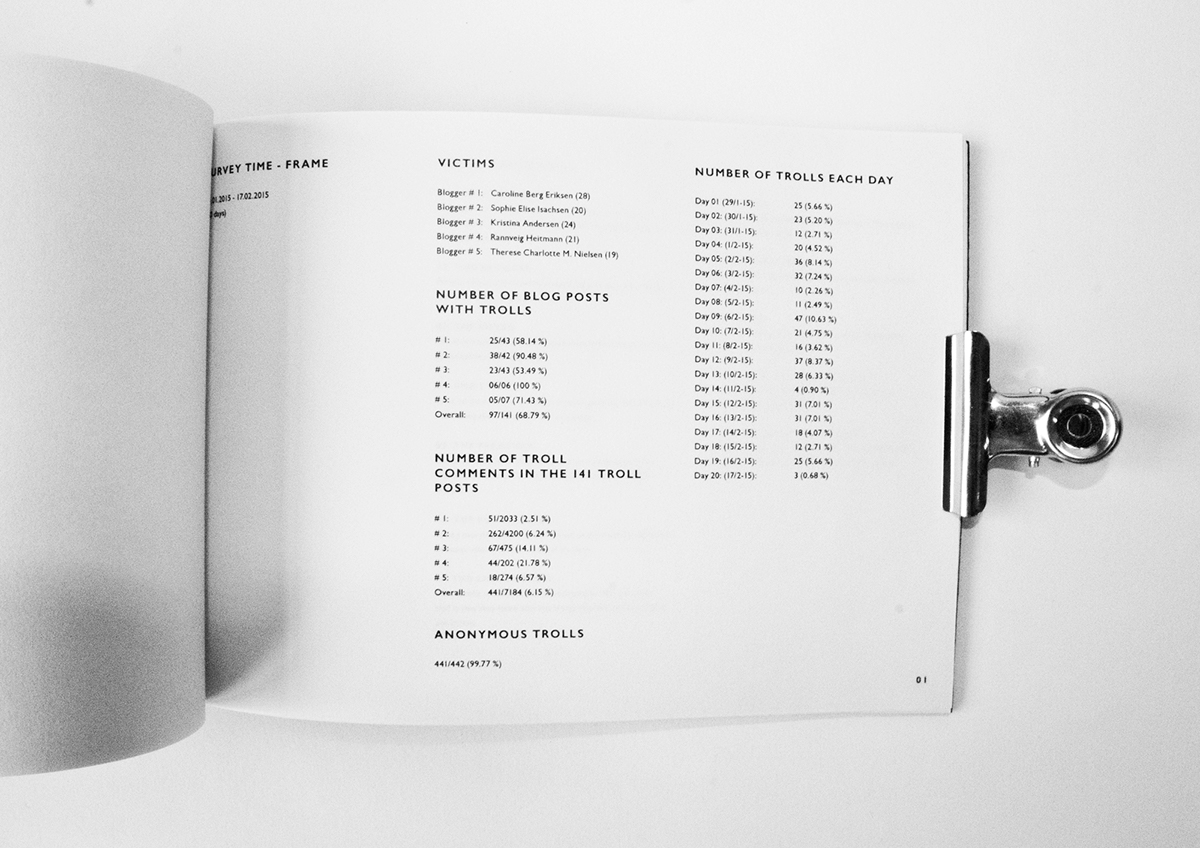
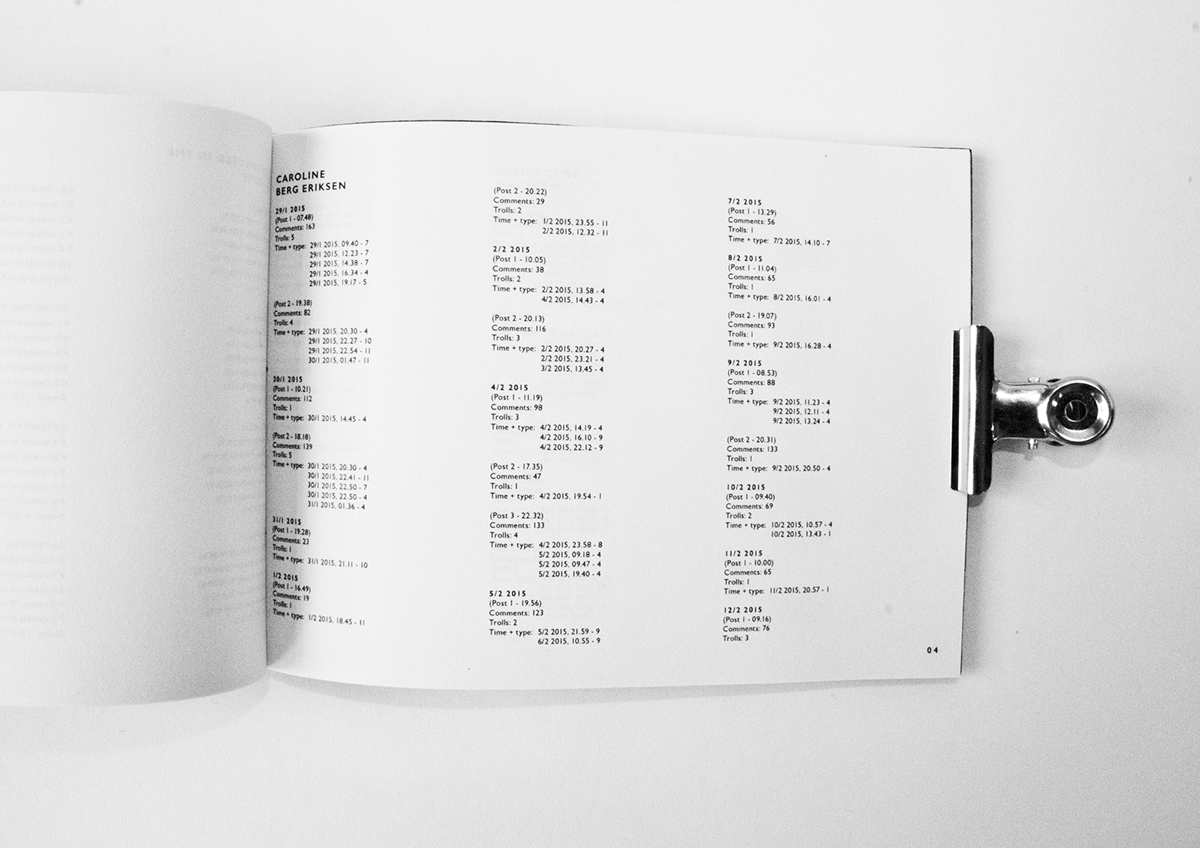
The Infographic shows the number of trolls, frequency and the type of trolls that were spotted in the comment sections. It is presumed that there has been a larger number of trolls in this period, since we know that the victims have the option to delete comments before they get published.


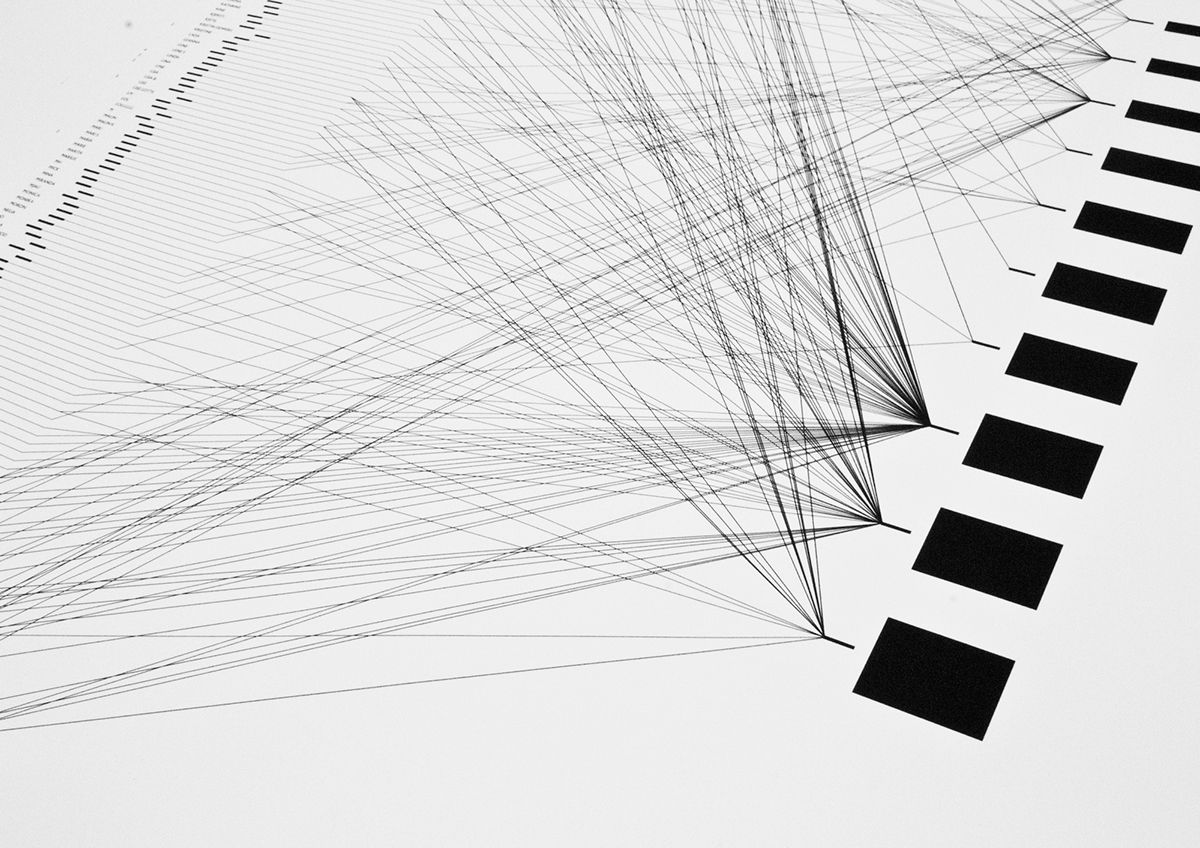
2.
The infographic shows the connection between the usernames and type of troll. Almost half of the trolls have not typed in any name at all. The list includes some of the most common and typical names that are easy to get on. Many usernames are also repeated several times. This might be a clue that some of the different trolls may be linked up to the same person. Some have filled in both first name and surname, but there is no link or proof of that this is true.

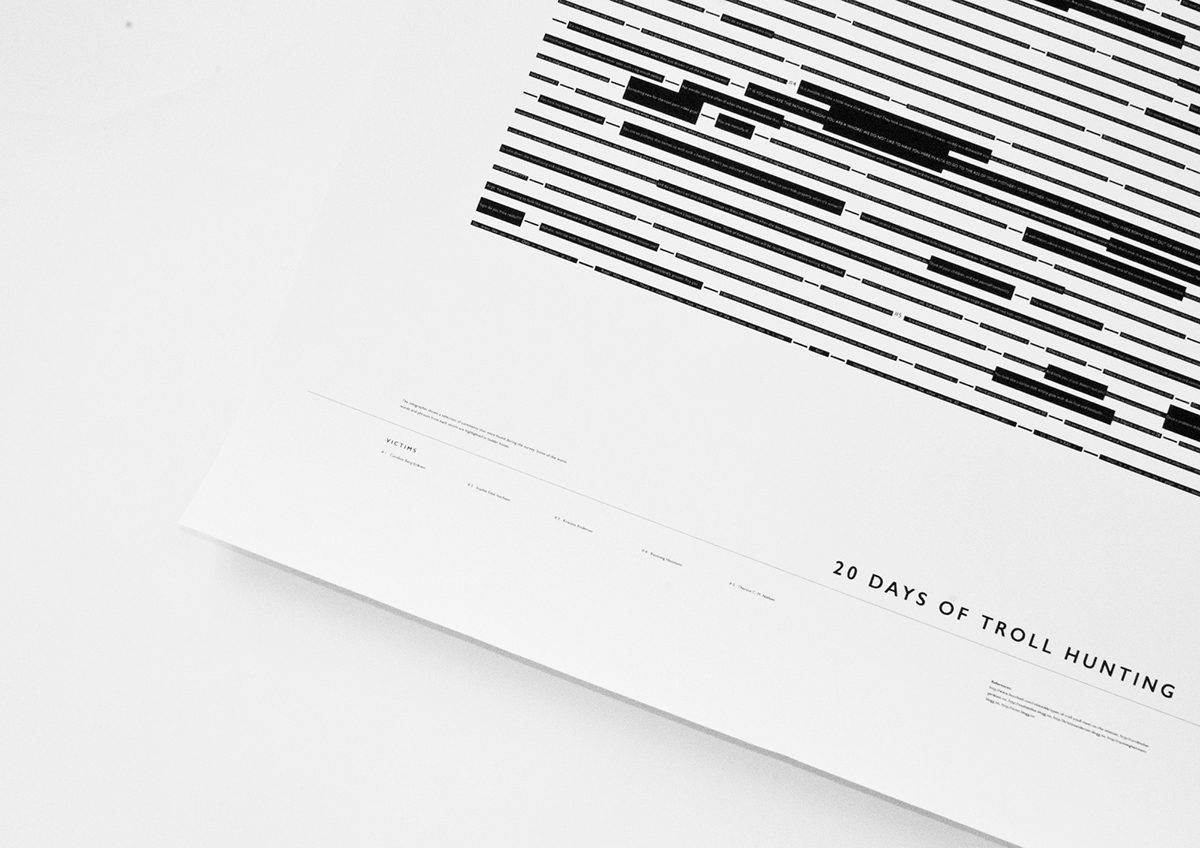
3.
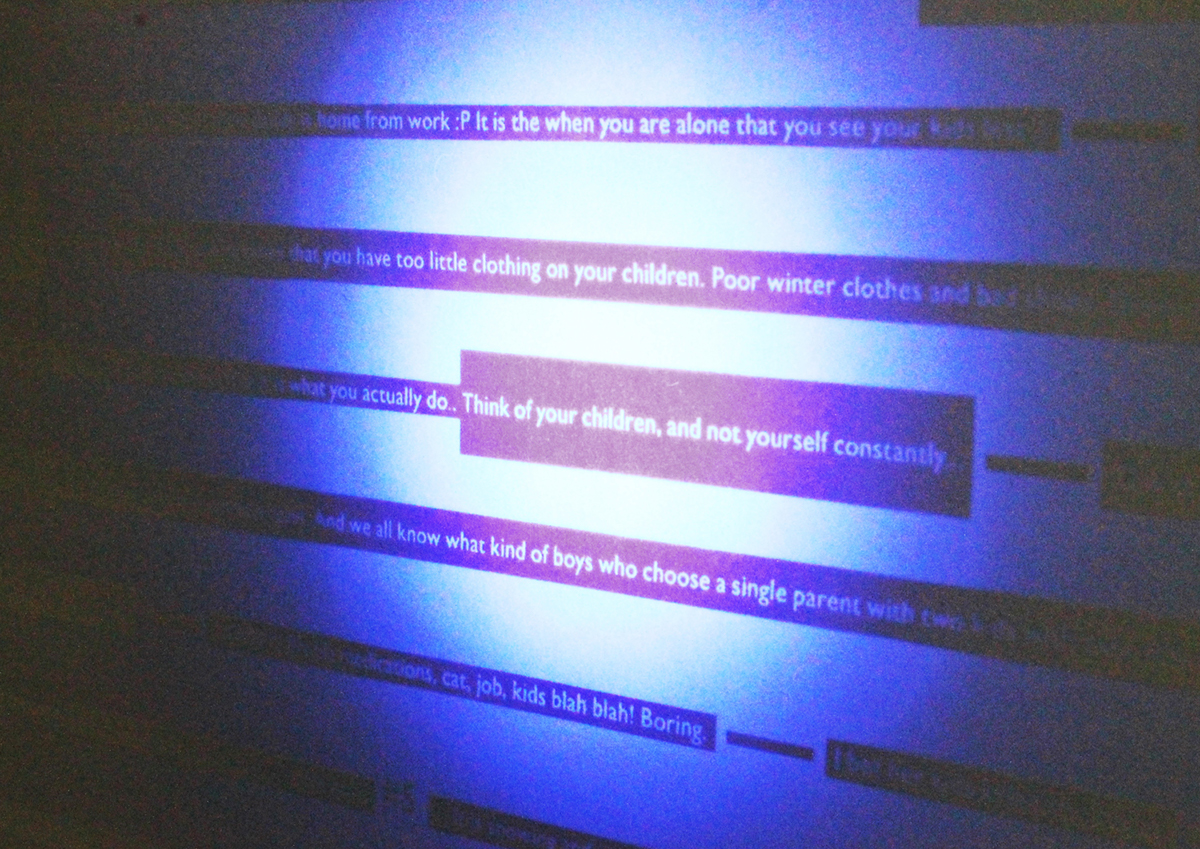
The infographic shows a selection of comments that were found during the survey. Some of the worst words and phrases from each victim are highlighted in bolder boxes.

P O S T E R T U B E & S U R V E Y


E X H I B I T I O N:
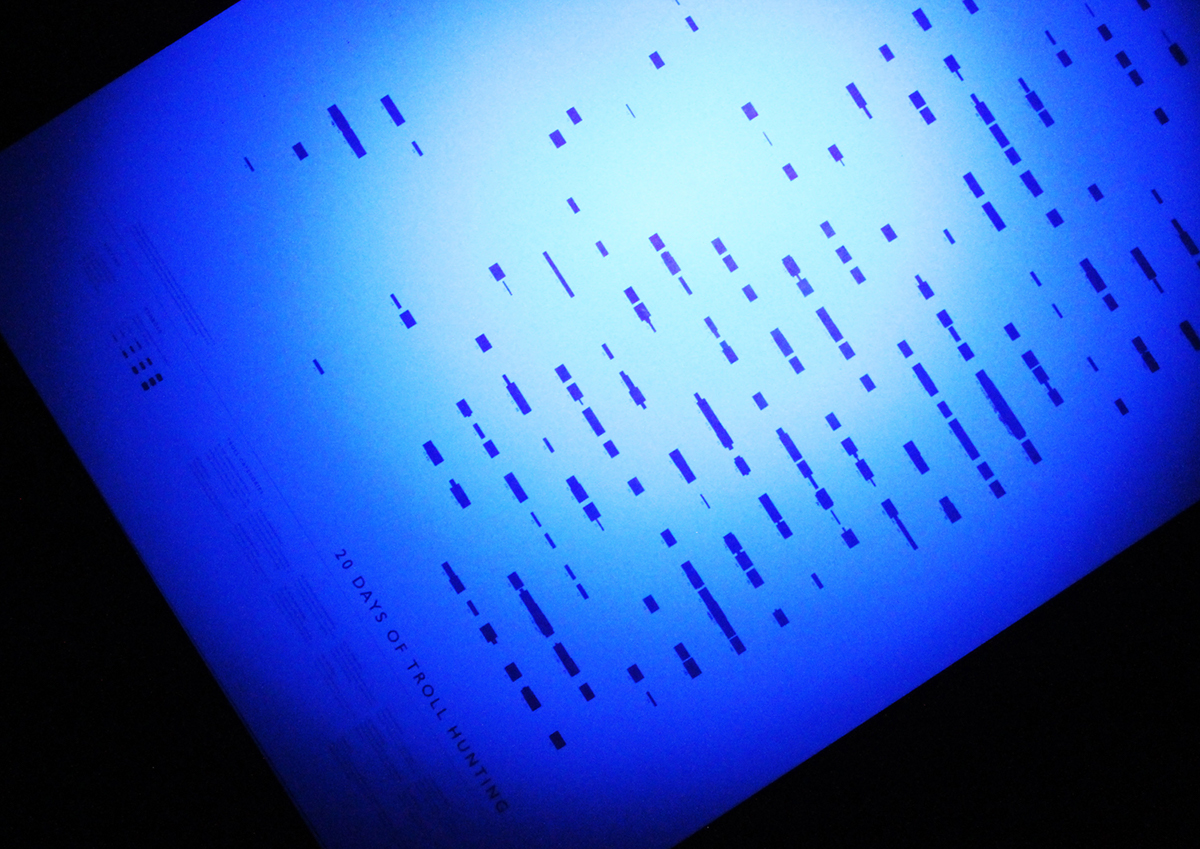
(The posters are screenprinted in white on white, and the trolls can only be seen with blacklight.)
"Hunt them down. They are hiding behind their anonymity..."


B A N N E R
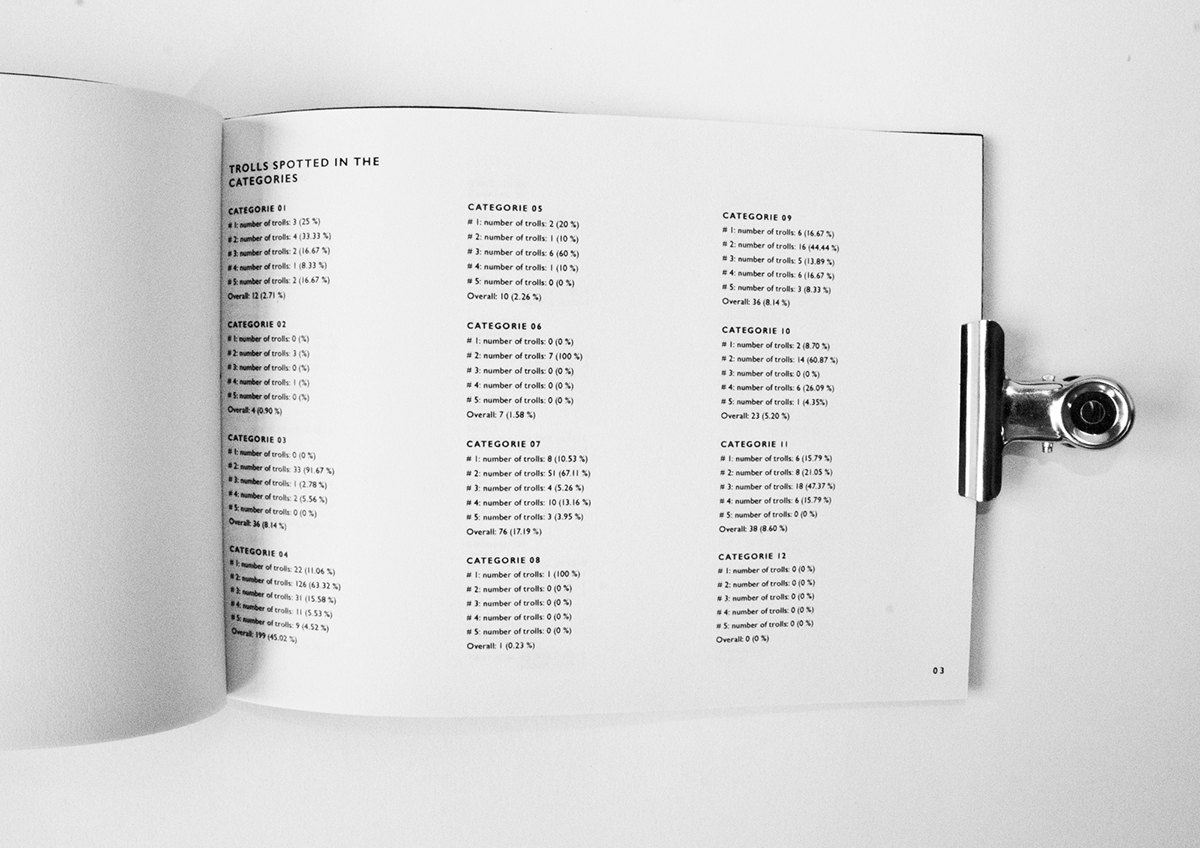
The infographic is showing the percentage of troll that was found from each categorie in the period. The percentage is in overall for all the five victims.


