Take an everyday item (a biro) and create a visual outcome based on the process of discovery about said object.
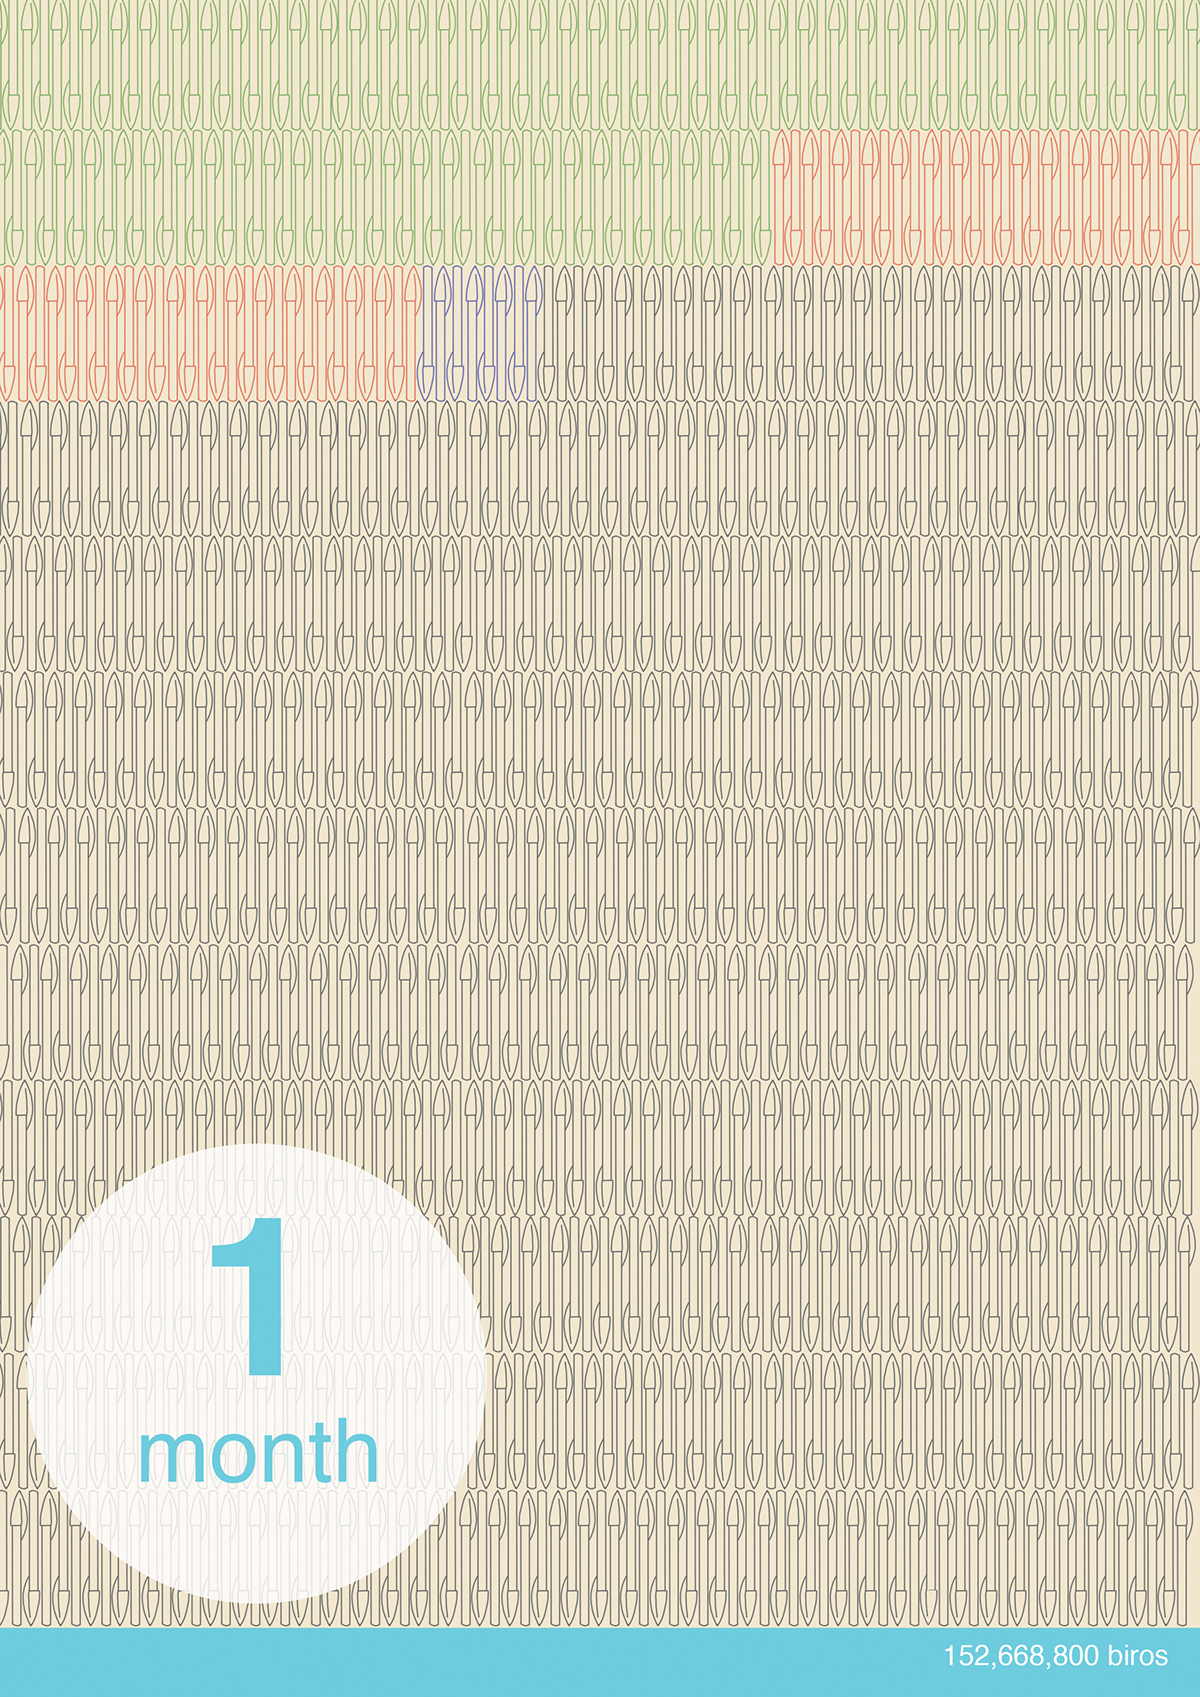
I focused my research on how many biros have been sold, as eveyone seems to have an endless supply of them, and found the statistic than 57 biros are sold every second so created a series of infographics based around this fact.