Data Visualization on Inequality of Society
Arch+, Stiftung Bauhaus
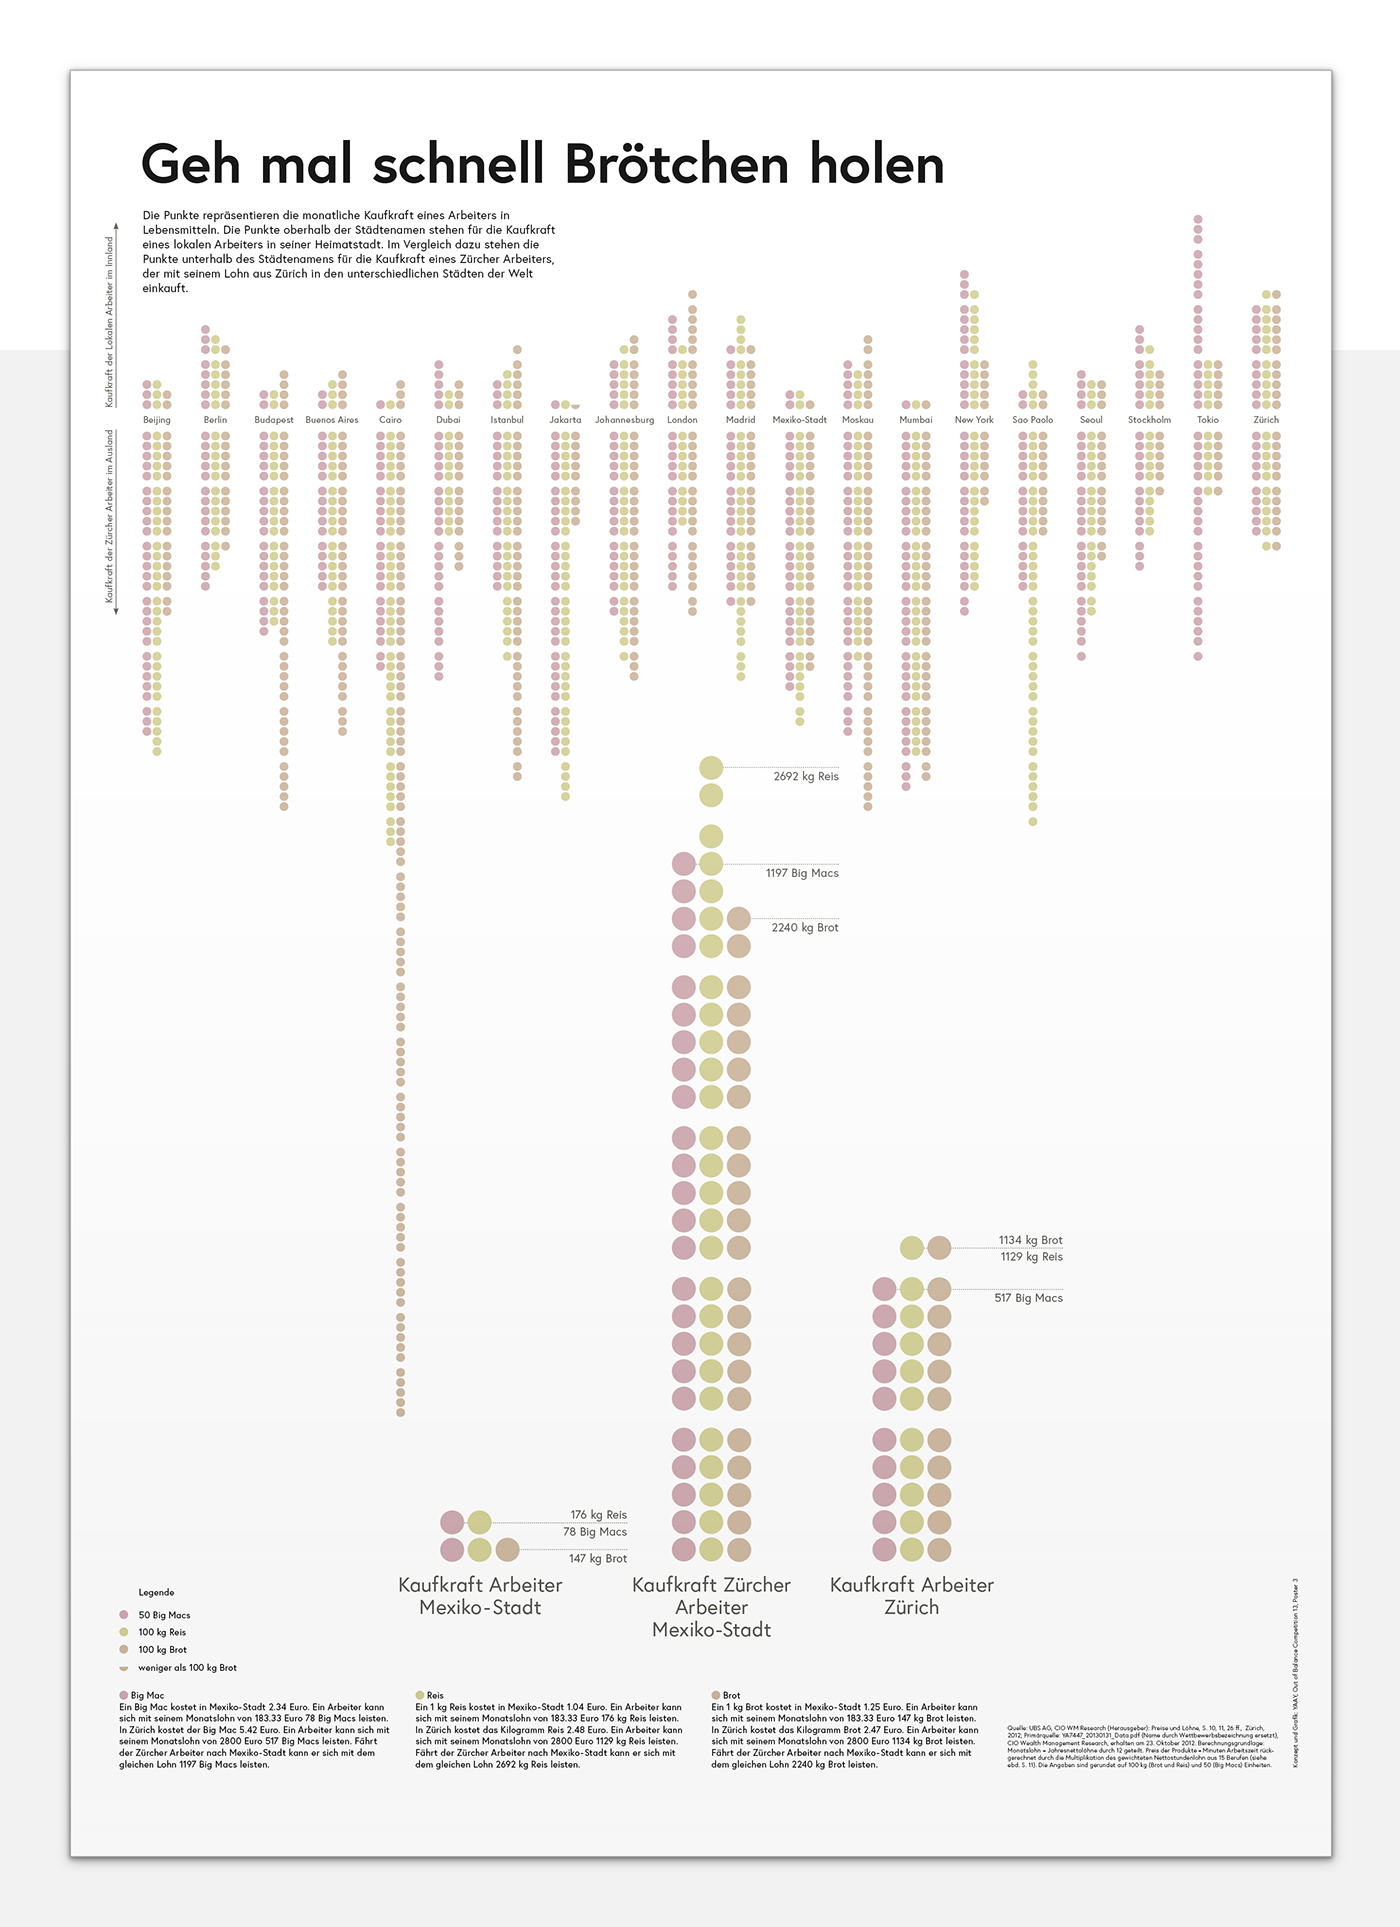
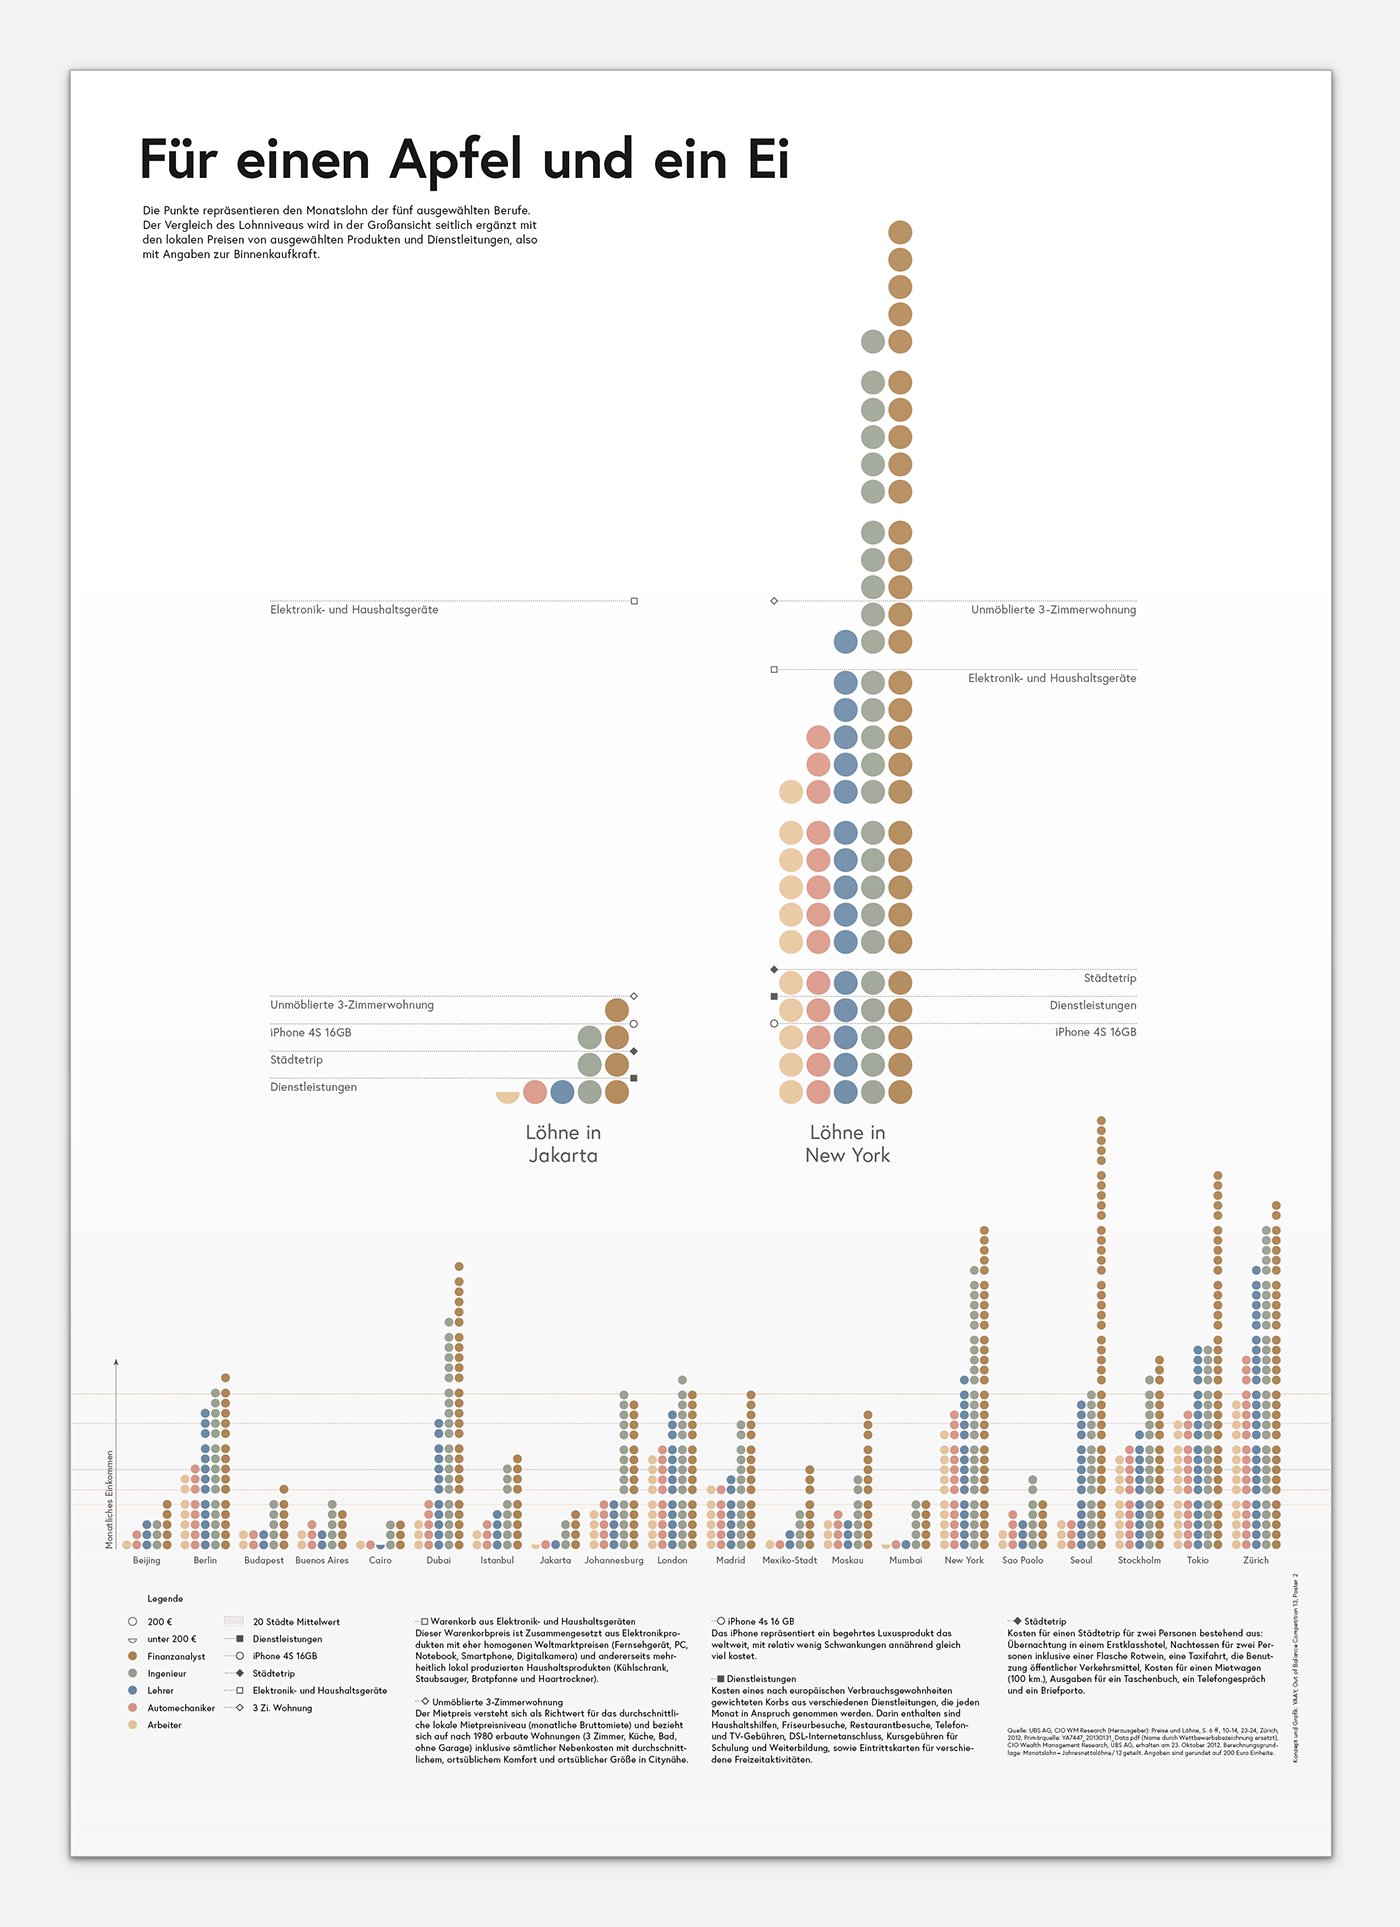
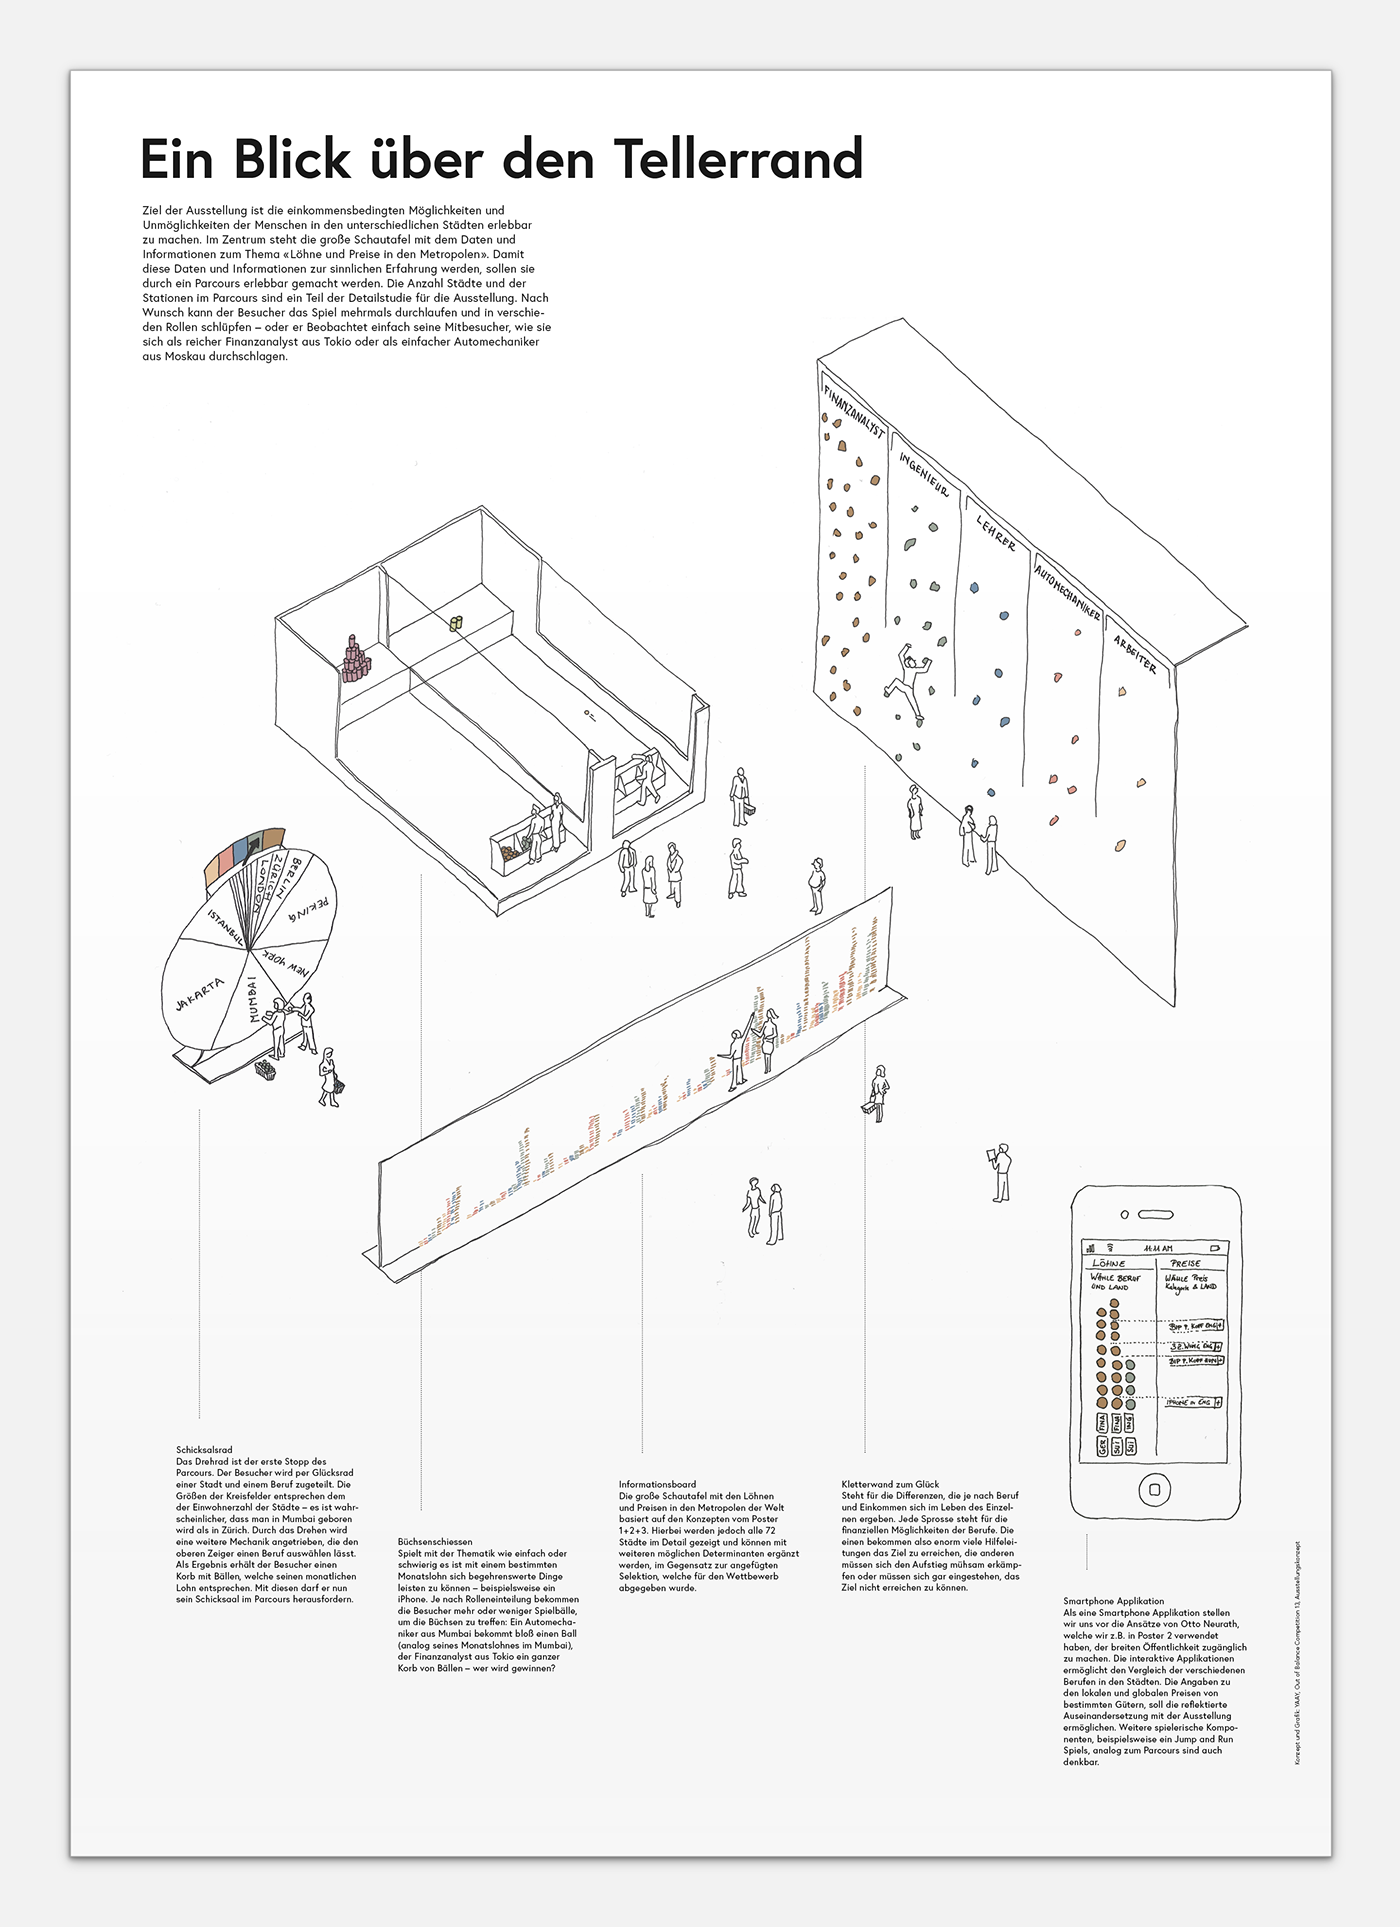
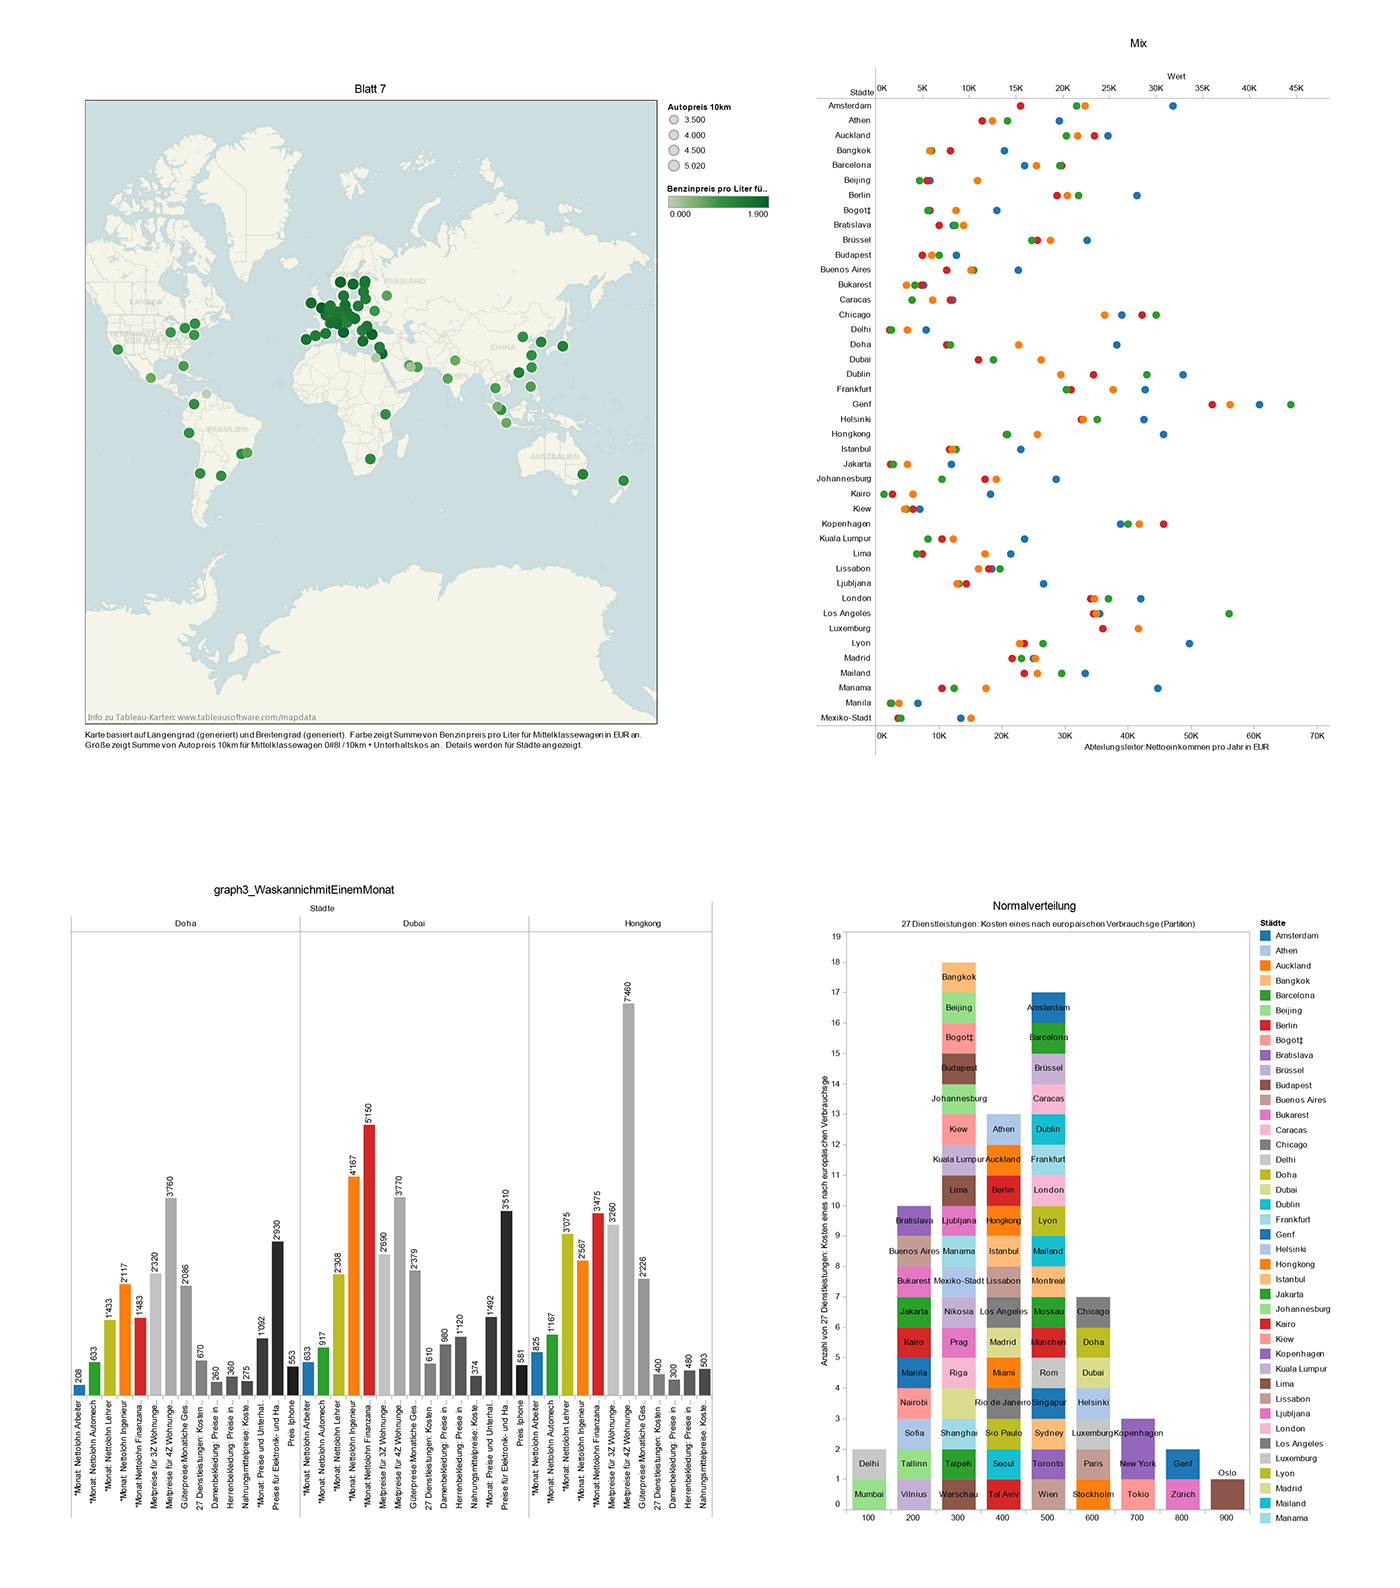
Arch+, an industry-leading architecture journal tied Bauhaus, launched a competition in 2013. Driven by data, the competition required entrants to visualize the state of the society. The outcome should have a focus on today’s global problems of social inequality, injustice and exclusions. We were challenged to identify and analyse data in order to shine a light global societal problems. As a reference and basis for the data analysis Superdot used the global study “Purchasing power comparison of the world”, conducted by the Swiss bank UBS. We analysed diverse data sets collected in 74 world metropolises on the topic of prices and earnings for every significant job group.
Ultimately we achieved a reduction of complexity, developing into a story which was previously invisible. We visualized our findings in three posters which present critical perspectives of the world’s society: chance and income differences. Superdot conceptualized and designed a clean, neatly organised visual language to observe and compare the results without being lost in raw data. Our product was awarded with the first prize in the international competition, ranked against 422 other participants. In addition, Arch+ featured the results in a special issue.