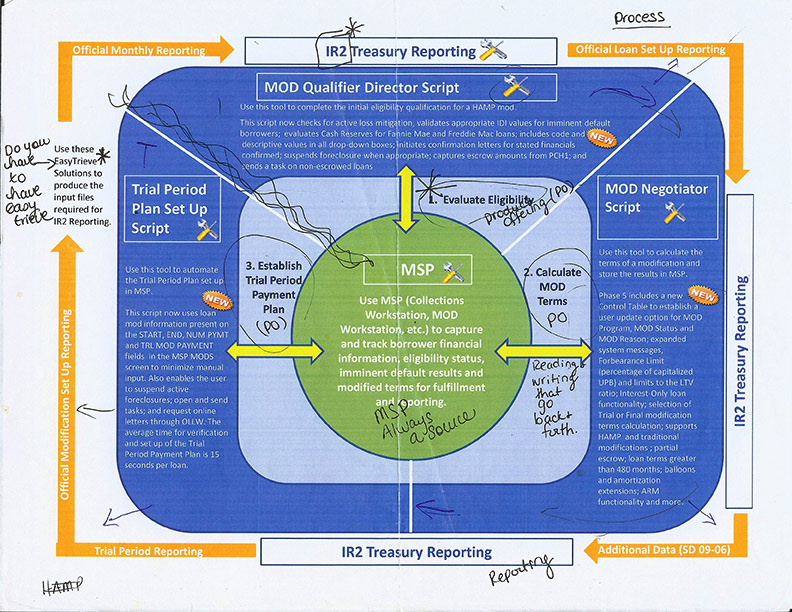
Diagram #1
This is the original document supplied by the department manager and programmers. Usually it's a printed version of a PowerPoint slide. Initial meetings are full of questions and answers. It's like playing detective. What is a MOD Qualifier Director Script? What do the yellow arrows represent? Why are the orange arrows outside the blue box? Are there any processes that overlap? I listen carefully to pick up on key works mentioned or design ideas thrown about.
Once we have an understanding of the product and what the client wants to say, it's time to start the design process. I go back to my desk and begin to sketch. The account manager wants to see a baseball theme and the Creative Director mentioned something about a glass or transparent house. I had a more circular diagram in mind.

The first of two ideas is created in Illustrator and submitted for comments. It is the baseball theme.


The Creative Director says this is a good start but wants to see a second version and play up the transparent house. A second design is requested so that two options can be presented to the client.

It quickly becomes obvious that a truly transparent look will be too time consuming. The second design needs to be simplified. It's a risk but I have to take it. Below is the simplified version of the overly ambitious sketch above.
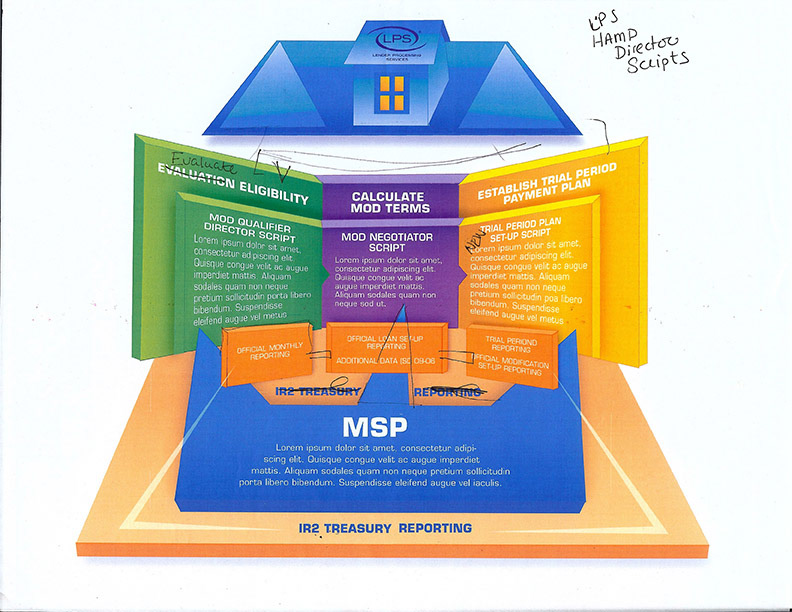
The two designs are presented to the client and the house is chosen. Colors are brightened and details are added to the diagram to clarify the message and process.
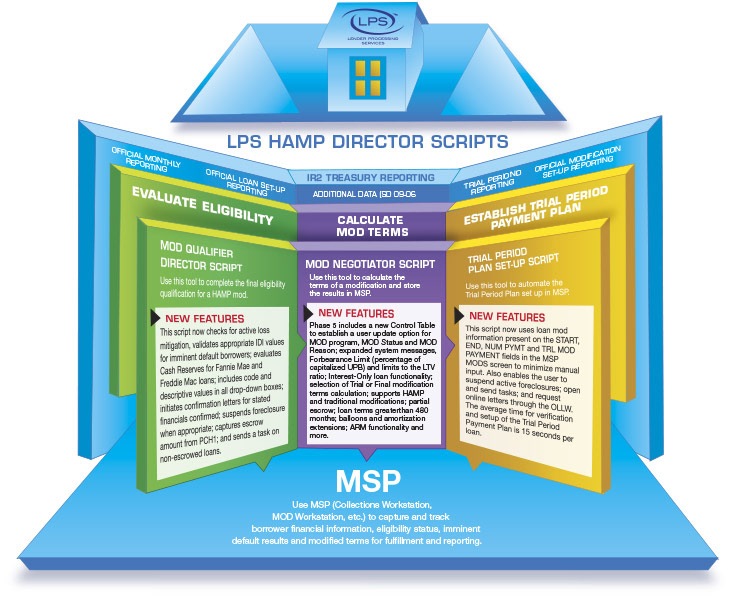
The next step is for the client to receive feedback from his team of requestors. It is decided that this design is too complicated. Some of the information needs to be dropped. Some members of the team also felt like the house design was too literal, that the diagram looks as if it is emphasizing the home-buyer rather than the loan servicer.
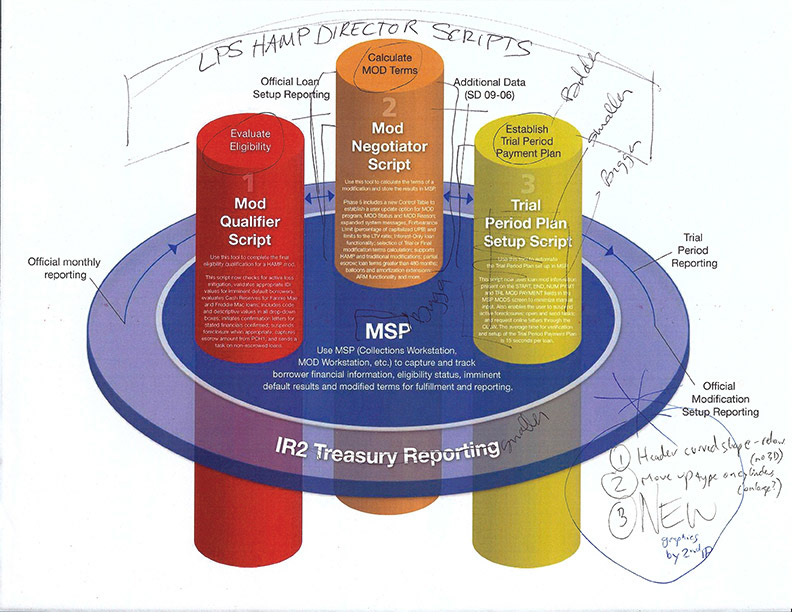
Somewhere in my notes there are sketches of a cylinder diagram that I think just might work. US IR2 Treasury Reports are the main reason for these new automated scripts. The Treasury needs to encompass the scripts as they report back and forth electronically all day. Even at this later stage, I am learning more details about the end product to refine the diagram.

Other, more pressing deadlines prevented me from finishing this diagram. Another designer on my team stepped in to finish the design, brightening the colors and adding back in the "New Features". This is the final diagram that was used in customer relationship newsletters, on web pages and in training PowerPoints.
Diagram #2
This diagram did not start with a PowerPoint slide or even a sketch. We simply met to discuss the process of the nightly MSP Eligibility Reviews. I asked about the look and feel of the diagram and the input was light-hearted. So I went to sketching and started creating shapes in Illustrator. In the end, this diagram would need to be built in pieces so that it could be animated in PowerPoint.
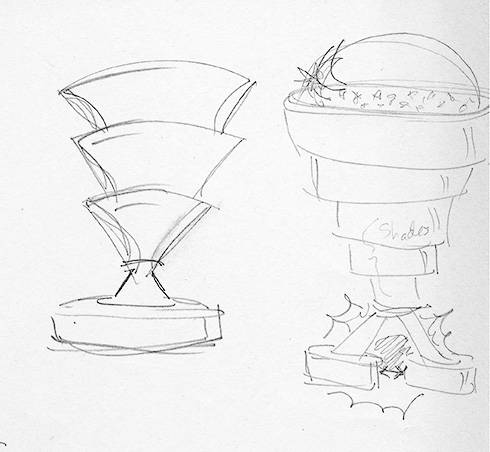
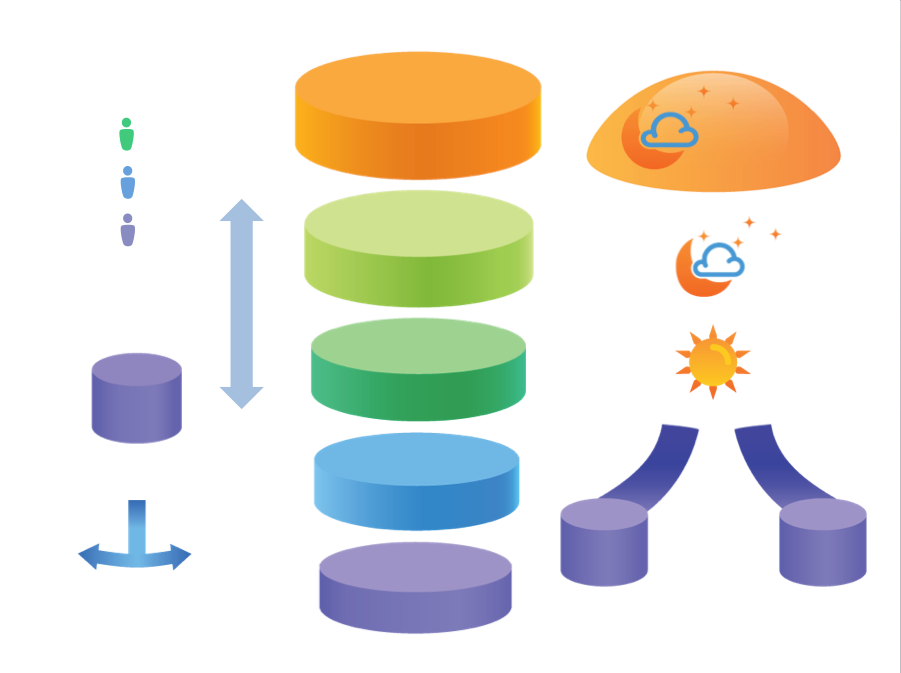
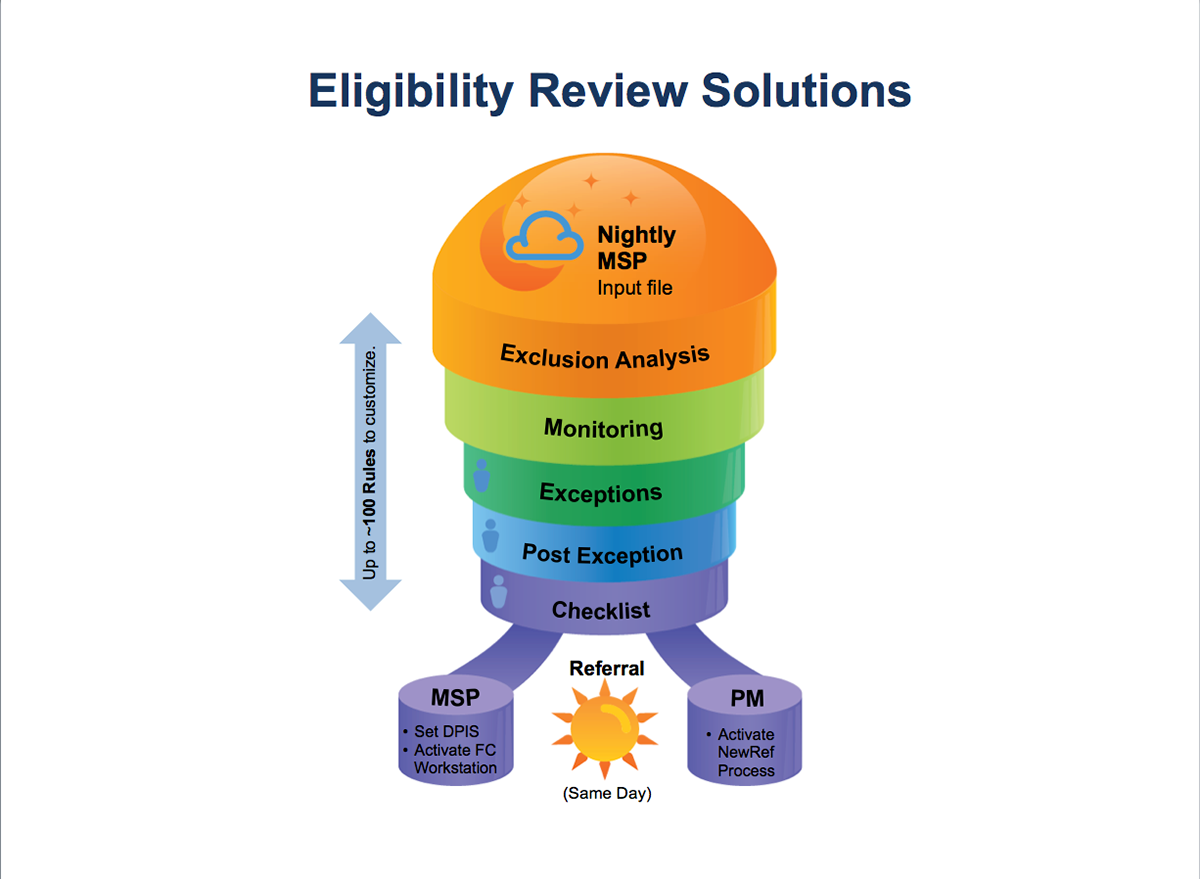
Diagram #3
Timelines can be simple or complex. I don't know why I liked this one the best except to say that the client was so pleased with the clean, clear results, it made me feel good.
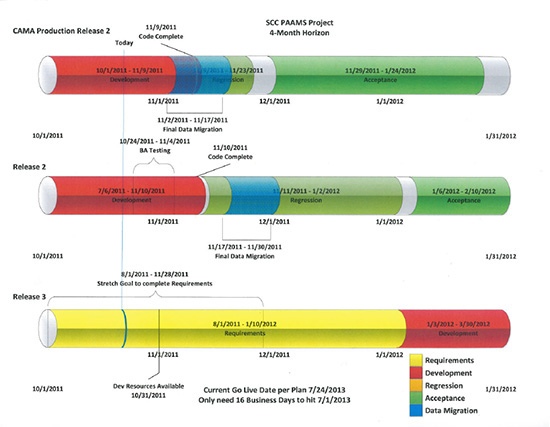
The image above is the original PowerPoint page, presented with the task request. As you can see form my notes below, this diagram took much more clarification and discussion. I put a green check mark by each item as we discussed it. Most of my notes were on a separate sheet of paper, which I did not keep. Even I couldn't read it later.
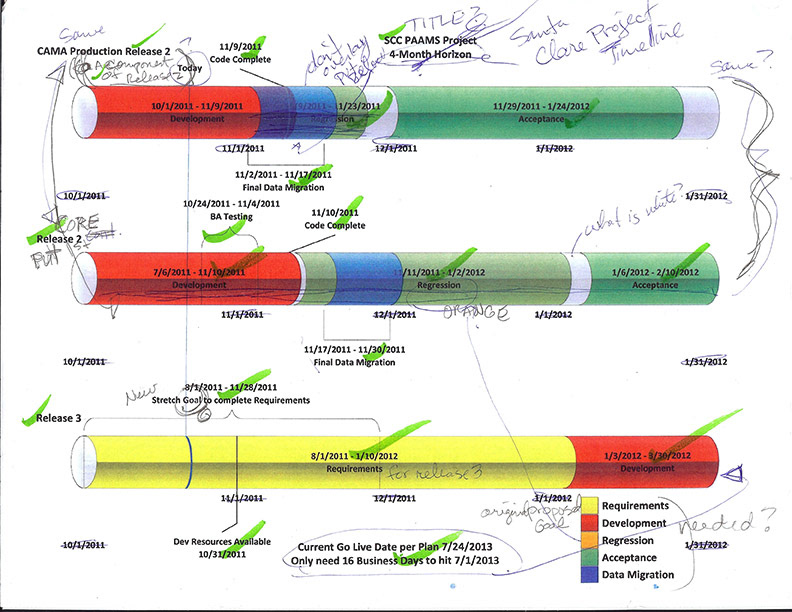
I made the color coded descriptions inside of the diagram bolder and did not include a key. This uncluttered the diagram, making the horizontal planes cleaner and gave me the ability to add the grid.

Because this client's office was not local, all the shapes for the final diagram were created in PowerPoint, not Illustrator so that the timeline could be easily edited or updated in the future.
I hope you enjoyed. These designs are not my property. Please do not share, thank you.


