An interesting visualization that guides investors make decision which startup firm and companies should they invest in to earn maximum profit. The key highlights are:
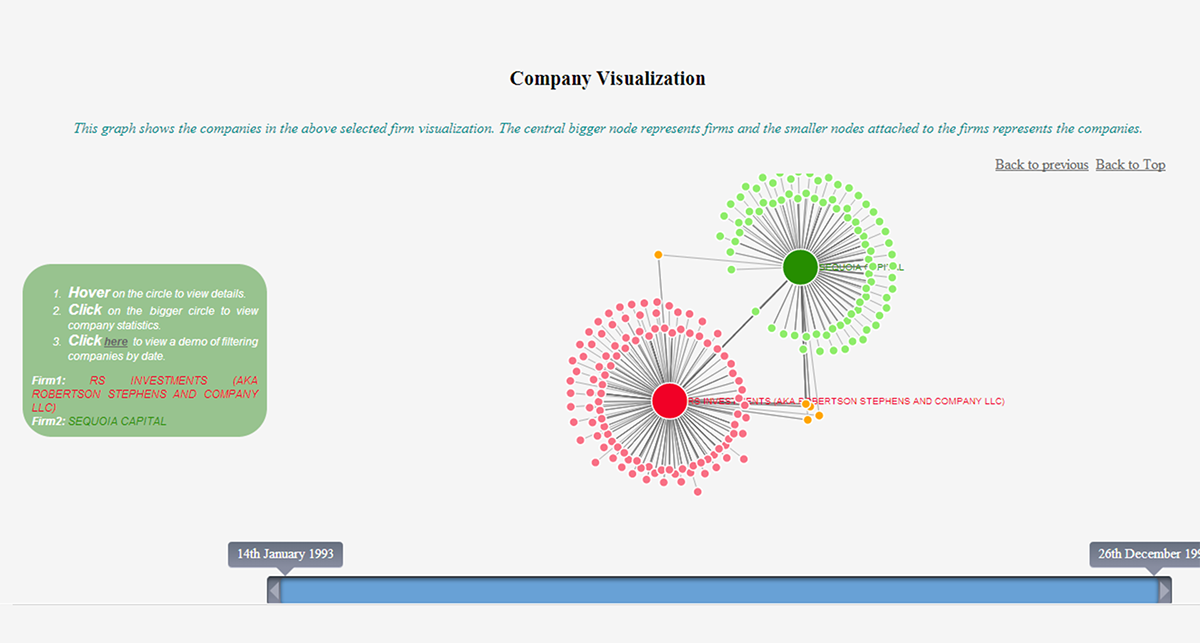
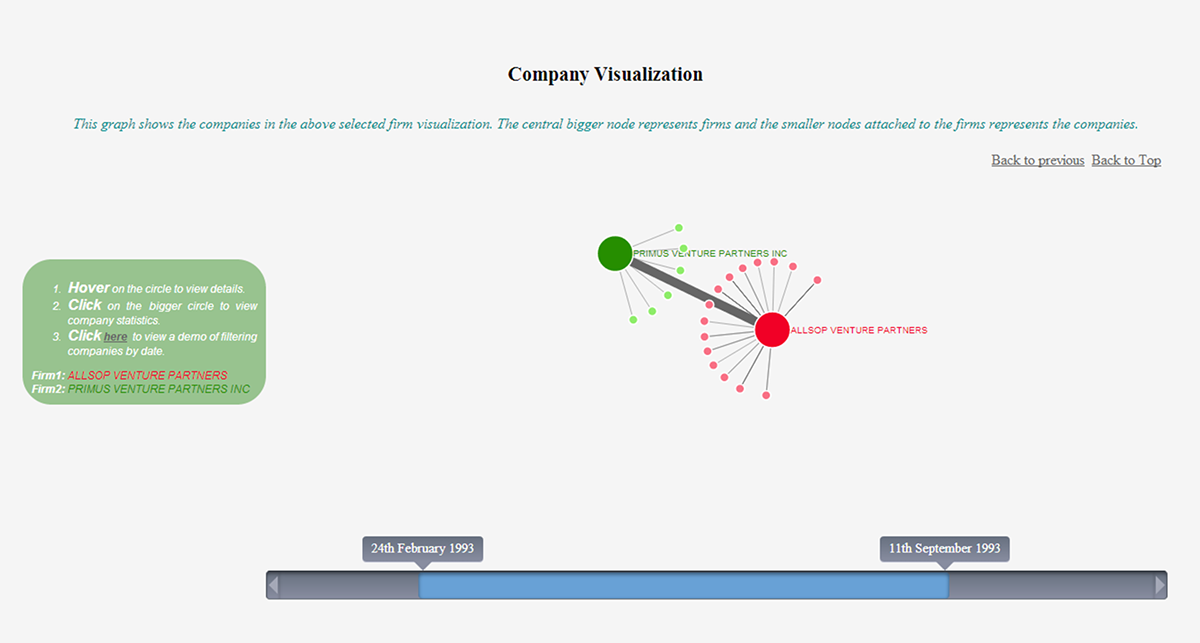
- Clustering of similar firms and interactions of firms with startups.
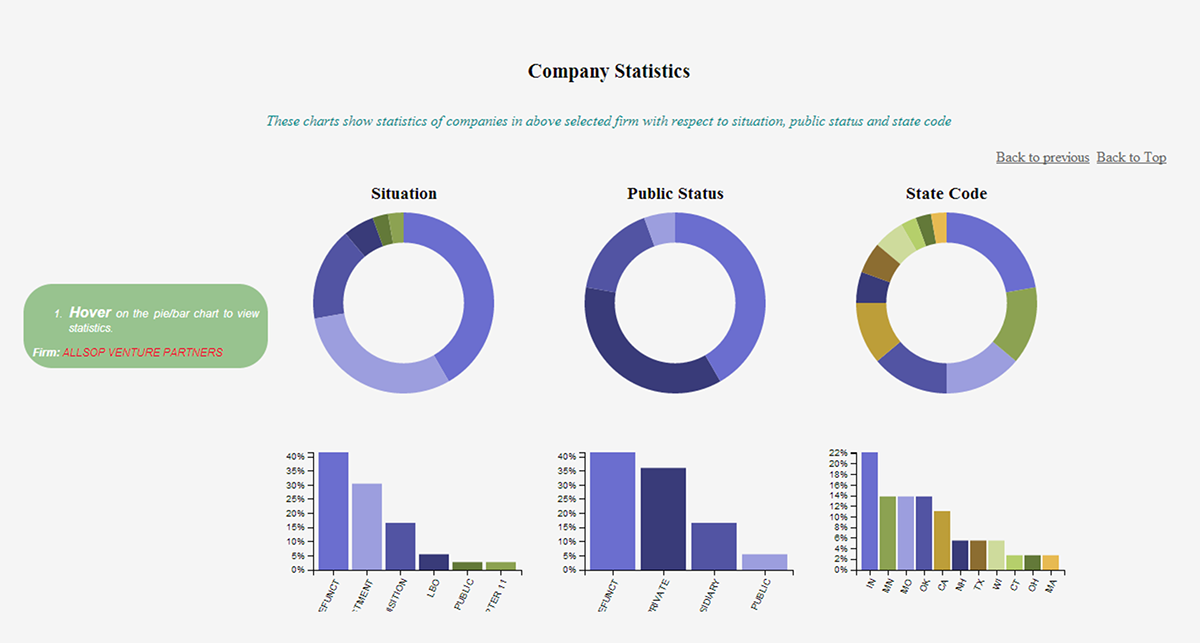
- Breakdown of similar firms and companies which have co-invested in same startups and status of each startup at the time of investment.
- Data mining in R to construct graphs for firms and startups.
- Heuristics were applied to cluster similar firms and companies.
- Data imported into MongoDB from R.
- Java spring was used to create RESTful web-service.
- d3.js for data visualization along with jQuery.
The visualization can be found at http://goo.gl/aVhPqV
Video demos for the visualization can be found here along with time series demo here
- Clustering of similar firms and interactions of firms with startups.
- Breakdown of similar firms and companies which have co-invested in same startups and status of each startup at the time of investment.
- Data mining in R to construct graphs for firms and startups.
- Heuristics were applied to cluster similar firms and companies.
- Data imported into MongoDB from R.
- Java spring was used to create RESTful web-service.
- d3.js for data visualization along with jQuery.
The visualization can be found at http://goo.gl/aVhPqV
Video demos for the visualization can be found here along with time series demo here
Demos
Investment Decision System Video Demo
nDataConsulting Time Series Demo
Screenshots