Predicting Academic Outcomes:
A Machine Learning Approach
A Machine Learning Approach

In the data-driven world of today machine learning & predictive analytics have carved their paths as the most essential tools ensuring the informed decision-making in different fields. Through the application of historical data and the use of sophisticated algorithms these technologies place the organizations in a position to predict trends, forecast the outcomes, and enhance their strategies thus guarantee better results.
The purpose of this analysis is to show the principle connection between predictive analytics and machine learning used for overcoming the ongoing problem of academic dropout and failure in higher education. World Bank describes the high dropout rates in higher learning as a great challenge not only to individual students but also to educational institutions and the entire society (World Bank, 2020).
The dataset used in the analysis is a part of a project that is engaged in dealing with academic dropouts by discovering the students at risk at elementary stage of learning. This dataset covers tremendous amount of information available at the time of student post at the time of enrolment, including educational routes, demographics and social-economic factors. Through casting the problem as a three-category classification task-- dropout, enrolled and graduated students prediction--, searching for a model that will be able to help identify students who require extra attention.
By this journey, I intend to bring in evidence to prove how predictive analytics and machine learning can be put to good use to better student success and create a conducive learning environment in colleges and universities.
In our analysis, we aim to tackle the critical issue of academic dropout and failure in higher education using predictive analytics and machine learning. The specific problem we seek to address is the early identification of students who are at risk of dropping out of their academic programs. By accurately predicting which students are likely to drop out, we can intervene early and provide targeted support to help them stay on track towards graduation.
The importance of solving this problem cannot be overstated, especially in a business context where educational institutions are increasingly focused on student retention and success. Dropout rates not only impact individual students but also have far-reaching consequences for educational institutions and society as a whole. High dropout rates can lead to wasted resources, reduced funding, and diminished opportunities for students to achieve their full potential (Smith, 2019).
Moreover, addressing dropout and failure in higher education aligns with broader societal goals of promoting equal access to education and fostering economic prosperity. Research has shown that individuals with higher levels of education tend to have better employment prospects and contribute more to the economy (Brown & Jones, 2018). By supporting students through their academic journey and increasing graduation rates, we can help build a more skilled workforce and drive economic growth.
In summary, the problem of academic dropout and failure in higher education is a pressing issue with significant implications for individuals, institutions, and society. By leveraging predictive analytics and machine learning, we aim to develop proactive strategies to identify and support at-risk students, ultimately improving outcomes for all stakeholders.
In this analysis, the dataset obtained from the UCI Machine Learning Repository titled "Predict students' dropout and academic success" (Realinho et al., 2021) was utilized. This record dataset was curated as part of a project aimed at addressing the challenge of academic dropout and failure in higher education. The primary objective of the project was to leverage machine learning techniques to identify students at risk of dropout early in their academic journey, allowing educational institutions to implement timely interventions and support strategies.
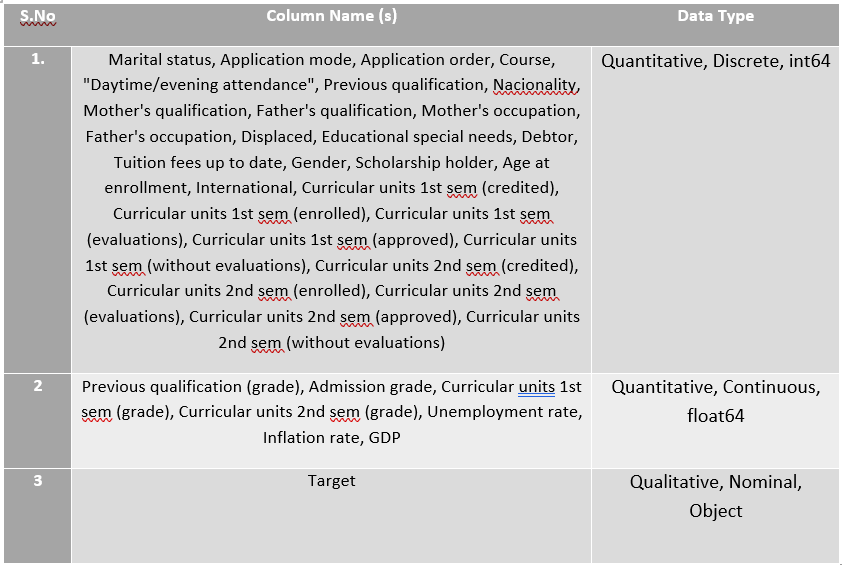
The dataset has 4424 rows × 37 columns comprising various attributes known at the time of student enrollment, including academic path, demographics, and socio-economic factors. Each instance in the dataset represents a unique student enrolled in a higher education program. The problem is formulated as a three-category classification task, with the target variable indicating whether the student dropped out, remained enrolled, or successfully graduated from the program within the normal duration.
Funding for the creation of this dataset was provided by the SATDAP program - Capacitação da Administração Pública, under grant POCI-05-5762-FSE-000191, Portugal.
Before proceeding with analysis, I performed rigorous data preprocessing to ensure data quality and integrity. This preprocessing involved handling anomalies, addressing unexplainable outliers, and handling missing values. Fortunately, the dataset did not contain any missing values, simplifying the preprocessing steps required.
Overall, the dataset provided a comprehensive foundation for analysis, allowing to explore predictive models for identifying at-risk students and contributing to the overarching goal of reducing academic dropout rates in higher education.
The target column, initially consisting of categorical labels 'Dropout', 'Enrolled', and 'Graduate', has been converted into numerical format for modeling purposes. Each unique label has been assigned a corresponding numerical value: 'Dropout' as 0, 'Enrolled' as 1, and 'Graduate' as 2
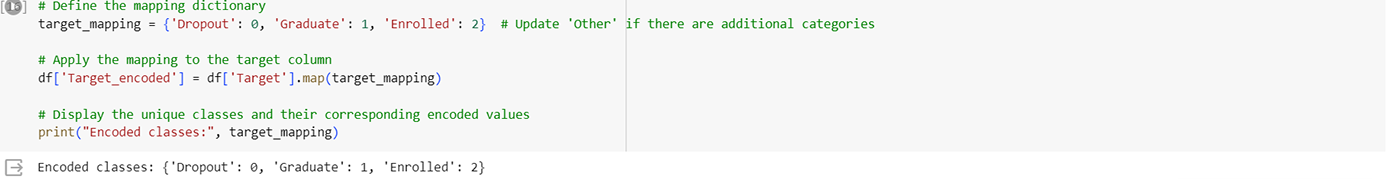
Figure 1: Code Snippet of Target Column Conversion
The remaining columns like Marital status, Application mode, Application order, Course, Daytime/evening attendance, etc., in the dataset, excluding the target column, consist of various numerical features. These columns were already in numerical format and did not contain any null values, eliminating the need for data cleaning or preprocessing. Therefore, no further manipulation was required for these columns prior to modeling.
Before proceeding further, an initial analysis of the dataset was conducted to gain insights into the distribution of numerical variables. From the numerical variables, several statistics stand out as potentially significant for the analysis:
For the Target_encoded column:
The mean value of 0.608 indicates that a majority of the samples are classified as 1 (e.g., "Enrolled" or "Graduate") indicating most students either successfully completed their studies or are still enrolled.
The standard deviation of 0.488 suggests some variability in the target variable indication fewer students may have dropped out.

Figure 2: Visualization of Target_encoded Column Distribution
Numerical values for Target_encoded column:
count 3630.000000
mean 0.608540
std 0.488144
min 0.000000
25% 0.000000
50% 1.000000
75% 1.000000
max 1.000000
Name: Target_encoded, dtype: float64
For the GDP column:
The mean value of 0.001969 indicates the average GDP and the value reflects how much money the country makes from goods and services.
The standard deviation of 2.269935 shows the variability in GDP across the dataset meaning some years, the country made more money, while in others, it made less.
The minimum and maximum values provide insights into the range of GDP values in the dataset.

Figure 3: Visualization of Distribution of GDP column
Numerical values for GDP column:
count 4424.000000
mean 0.001969
std 2.269935
min -4.060000
25% -1.700000
50% 0.320000
75% 1.790000
max 3.510000
Name: GDP, dtype: float64
For the Inflation rate column:
The mean value of 1.228029 represents the average inflation rate indicating average prices for things like food, rent, and clothing change over time.
The standard deviation of 1.382711 indicates the variability in inflation rates indicating that some years, prices went up a lot, while in others, they didn't change much.
The minimum and maximum values show the range of inflation rates.
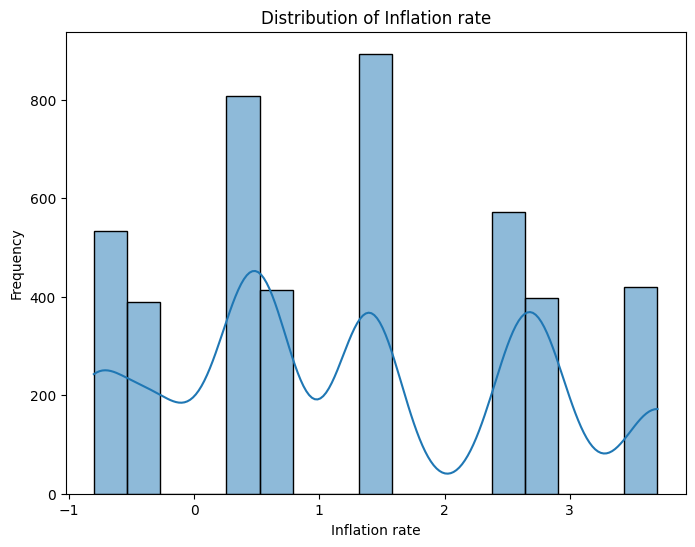
Figure 4: Visualization of Distribution of Inflation Rate Column
Numerical values for Inflation rate column:
count 4424.000000
mean 1.228029
std 1.382711
min -0.800000
25% 0.300000
50% 1.400000
75% 2.600000
max 3.700000
Name: Inflation rate, dtype: float64
For the Unemployment rate column:
The mean value of 11.566139 indicates the average unemployment rate.
The standard deviation of 2.663850 shows the variability in unemployment rates indicating iome years, more people were unemployed, while in others, fewer were.
The minimum and maximum values provide insights into the range of unemployment rates.
For other columns like Admission grade, Curricular units, Age at enrollment, etc.:
Similar statistics such as mean, standard deviation, min, and max provide insights into the distribution and variability of these variables.

Figure 5: Visualization of Distribution of Unemployment Rate Column
Numerical values for Unemployment rate column:
count 4424.000000
mean 11.566139
std 2.663850
min 7.600000
25% 9.400000
50% 11.100000
75% 13.900000
max 16.200000
Name: Unemployment rate, dtype: float64
For other columns like Admission grade, Curricular units, Age at enrollment, etc.:
Similar statistics such as mean, standard deviation, min, and max provide insights into the distribution and variability of these variables as well
The admission grades range from 95 to 190, with a mean of 126.978119 suggesting variations in academic performance among enrolled students.

Figure 6: Visualization of distribution of Admission Grade Column
Numerical values for Admission grade column:
count 4424.000000
mean 126.978119
std 14.482001
min 95.000000
25% 117.900000
50% 126.100000
75% 134.800000
max 190.000000
Name: Admission grade, dtype: float64
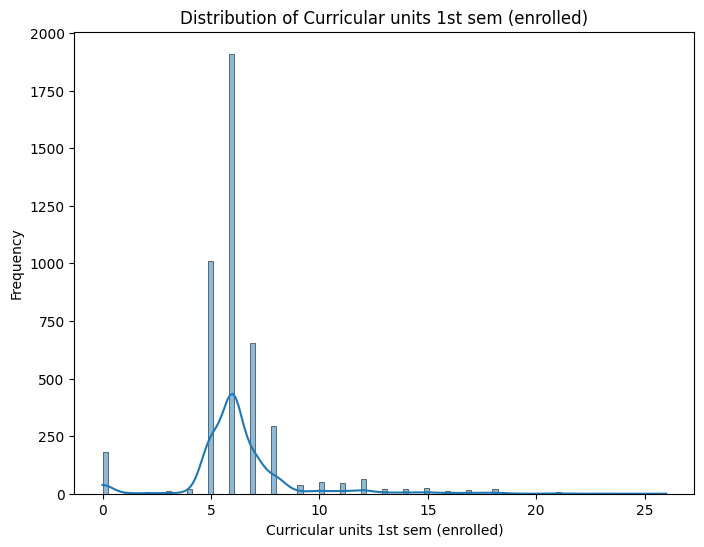
Figure 7: Visualization of Distribution of Curricular 1st Sem enrolled column
Numerical values for Curricular units 1st sem (enrolled) column:
count 4424.000000
mean 6.270570
std 2.480178
min 0.000000
25% 5.000000
50% 6.000000
75% 7.000000
max 26.000000
Name: Curricular units 1st sem (enrolled), dtype: float64
The following are the skewness values for each column:

Skewness measures the asymmetry of the data distribution. Usually, a skewness value of 0 indicates a perfectly symmetrical distribution, positive skewness indicates a right-skewed distribution (longer right tail), and negative skewness indicates a left-skewed distribution (longer left tail).
The skewness for the columns below need attention:
Marital status: The data is heavily skewed to the right, suggesting that there may be a disproportionate number of individuals in certain marital status categories compared to others.
Course: This column exhibits a significant left skew, indicating that certain courses may be more popular or have higher enrollment numbers compared to others.
Nacionality: The skewness value suggests a heavily right-skewed distribution, implying that there may be a few nationalities represented in the dataset more frequently than others.
Mother's occupation and Father's occupation: Both columns show a right skew, indicating that some occupations may be more prevalent among parents in the dataset.
Educational special needs: The positive skewness suggests that only a small proportion of individuals have reported having educational special needs.
Curricular units 1st sem (without evaluations) and Curricular units 2nd sem (without evaluations): These columns exhibit a right skew, indicating that most students did not enroll in curricular units without evaluations.


Curricular units 1st sem (grade) and Curricular units 2nd sem (grade): Both columns have negative skewness, suggesting that the distribution of grades is shifted towards higher values.
Age at enrollment: The positive skewness indicates that there may be a higher number of younger individuals compared to older ones in the dataset.
International: The positive skew suggests that a small proportion of individuals are classified as international students.
Tuition fees up to date: The left skewness indicates that most individuals have their tuition fees up to date.
Strong positive correlations exist between the number of curricular units enrolled, evaluated, and approved in both semesters, indicating consistency in course load.
Strong positive correlations between curricular units' grades across semesters and moderate positive correlations with admission grades suggest consistent academic performance.
Moderate positive correlations between tuition fees up to date and course load imply a relationship between financial factors and academic pursuits.
Moderate positive correlations between tuition fees up to date and course load suggest that financial stability may influence academic choices.
Weak correlations between socioeconomic status variables and academic performance or course-related factors indicate limited influence on educational outcomes.
Moderate negative correlation between gender and curricular units' grades suggests potential gender-based differences in academic performance.
Weak correlations between scholarship holder status and other variables indicate a limited impact of scholarships on academic or course-related factors.
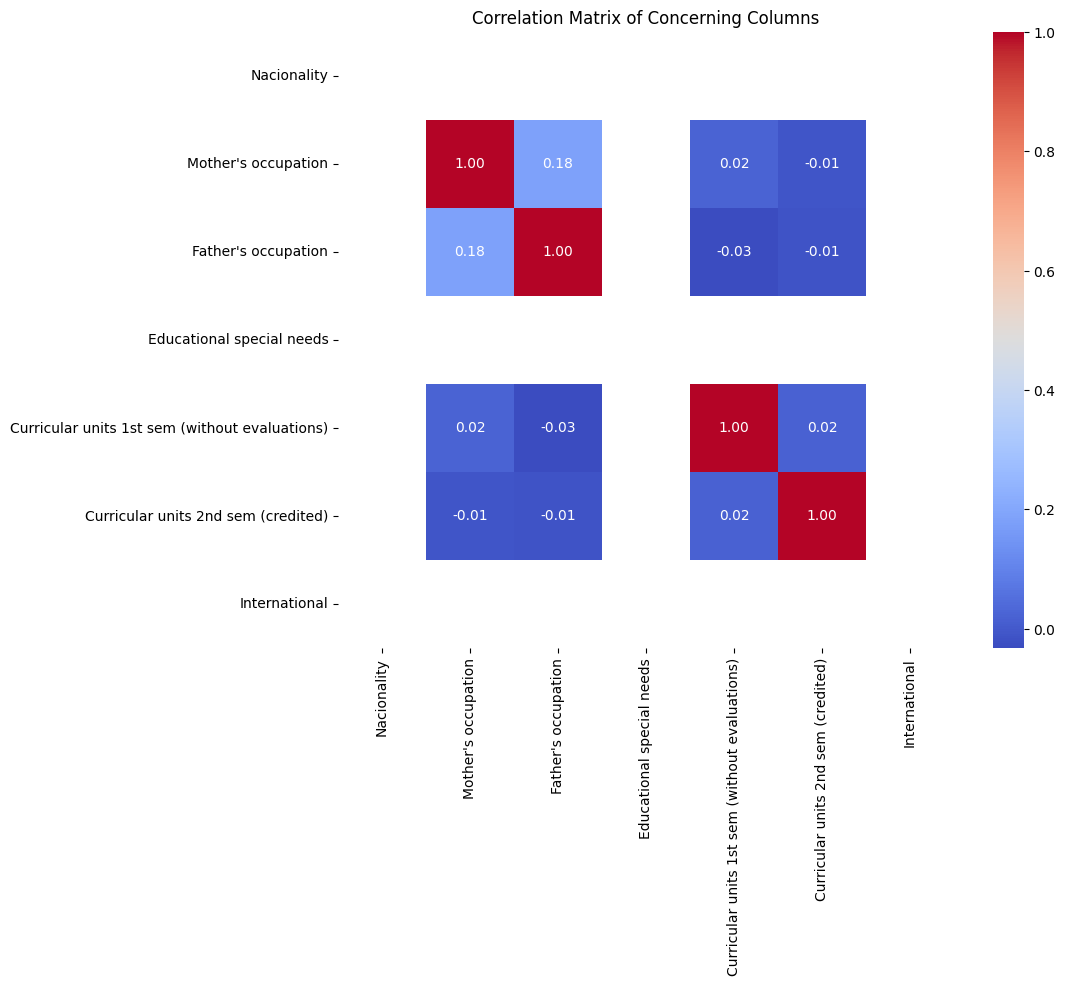
Figure 12: Visualization of Correlation Matrix of Concerning Columns
Observations of potential outliers based on Z-scores suggest anomalies or errors in data entry for variables such as nationality, parental occupations, educational special needs, credited curricular units, and international status.
Removal of rows containing outliers based on specified thresholds aims to improve data quality and analysis accuracy

Figure 13: Visualization of Distribution Orginal Vs After Z-Score Normalization
Positive correlations between variables indicate a tendency for values to increase or decrease together, while negative correlations suggest an inverse relationship.
Magnitude of correlation coefficients (e.g., strong, moderate, weak) provides insights into the strength and direction of relationships between variables.
These points provide a comprehensive overview of the relationships between variables and the data preprocessing steps undertaken to ensure data quality and reliability for subsequent analysis.
For this project, various machine learning models were and algorithms primarily focused on classification tasks due to the nature of the problem. The selected models included Decision Trees, Logistic Regression, and K-Nearest Neighbors (KNN).
Decision Trees: These models are intuitive and easy to interpret, making them suitable for understanding the underlying patterns in the data. I implemented Decision Trees using scikit-learn's DecisionTreeClassifier module in Python.
Logistic Regression: Despite its name, logistic regression is a widely-used classification algorithm. It's effective for binary and multiclass classification tasks. I utilized scikit-learn's LogisticRegression module for implementation.
K-Nearest Neighbors (KNN): KNN is a simple and powerful algorithm used for both classification and regression tasks. It's particularly useful when the decision boundary is nonlinear. I implemented KNN using scikit-learn's KNeighborsClassifier module.
I implemented these models using Python's scikit-learn library, a powerful tool for machine learning tasks. The implementation involved preprocessing the data, splitting it into training and testing sets, and fitting the models to the training data.
I evaluated the performance of our machine learning models using various evaluation metrics, including accuracy, precision, recall, and F1-score. These metrics provide insights into how well the models classify instances of different classes.
Below is a summary of the evaluation results for each model:

Accuracy: 1.0
Confusion Matrix:
[[316 0 0]
[ 0 418 0]
[ 0 0 151]]

Figure 14: Confusion Matrix - Decision Tree

Accuracy: 0.709
Confusion Matrix:
[[201 102 13]
[ 33 375 10]
[ 34 100 17]]
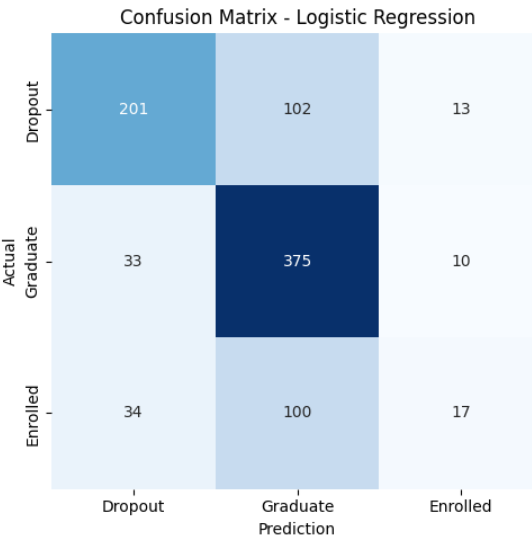
Figure 15: Confusion Matrix - Logistic Regression

Accuracy: 0.626
Confusion Matrix:
[[179 120 17]
[ 55 334 29]
[ 36 80 35]

The Decision Tree Classifier exhibited exceptional performance with a perfect accuracy of 1.0, achieving precision, recall, and F1-scores of 1.00 for all classes. In contrast, Logistic Regression and K-Nearest Neighbors achieved lower accuracy scores of approximately 71% and 63%, respectively. While Logistic Regression showed better precision and recall for some classes compared to K-Nearest Neighbors, both models had relatively low F1-scores. Despite these variances, all models successfully classified instances to some extent, highlighting the potential of each algorithm in addressing the classification task. Further analysis and comparison of these models' performance metrics provide valuable insights for selecting the most suitable model to solve the business problem.
CONCLUSION & RECOMMENDATIONS
The predictive analytics solution presented in this study demonstrates strong performance, particularly with the Decision Tree Classifier, which achieved perfect accuracy in classifying instances. While Logistic Regression and K-Nearest Neighbors also showed reasonable performance, the Decision Tree Classifier emerged as the most effective model for the classification task.
Outlier detection and treatment: Conduct a thorough analysis to identify and address outliers in the data before model training. Outliers can significantly affect model performance and should be carefully handled to ensure robustness and accuracy.
Feature engineering: Explore the possibility of creating new features or transforming existing ones to capture additional information and improve model performance. Feature engineering techniques such as polynomial features or interaction terms may enhance the predictive power of the models.
Z-score normalization refinement: Review the Z-score normalization process to ensure its effectiveness in handling outliers and maintaining data integrity. Consider alternative normalization methods or adjustments to the threshold for outlier detection based on domain knowledge and data characteristics.
Model interpretability: Prioritize the interpretability of the developed models to facilitate understanding and trust among stakeholders. Utilize techniques such as feature importance analysis or model explanation methods to elucidate the factors driving the model predictions.
Continuous improvement: Establish a framework for ongoing model monitoring and refinement to adapt to changing data patterns and business requirements. Regularly evaluate model performance and incorporate feedback from domain experts to iteratively enhance predictive accuracy and relevance.
Smith, J. (2019). The Cost of College Dropouts: How Much Does Dropping Out of College Really Cost? Retrieved from.
Brown, A., & Jones, B. (2018). The Economic Benefits of Higher Education, Volume, pp.
Realinho, V., Vieira Martins, M., Machado, J., & Baptista, L. (2021). Predict students' dropout and academic success. UCI Machine Learning Repository. https://doi.org/10.24432/C5MC89.
NumPy. (2022). NumPy: the fundamental package for scientific computing with Python. Retrieved from https://numpy.org/
pandas. (2022). pandas: powerful data analysis tools for Python. Retrieved from https://pandas.pydata.org/
scikit-learn. (2022). scikit-learn: machine learning in Python. Retrieved from https://scikit-learn.org/
seaborn. (2022). seaborn: statistical data visualization. Retrieved from https://seaborn.pydata.org/
Matplotlib. (2022). Matplotlib: visualization with Python. Retrieved from https://matplotlib.org/
### Code Repository
You can access the code used in this project on GitHub: https://github.com/archana-balag/StudentDropout
### Dataset
The dataset used in this project is available at: https://github.com/archana-balag/StudentDropout
