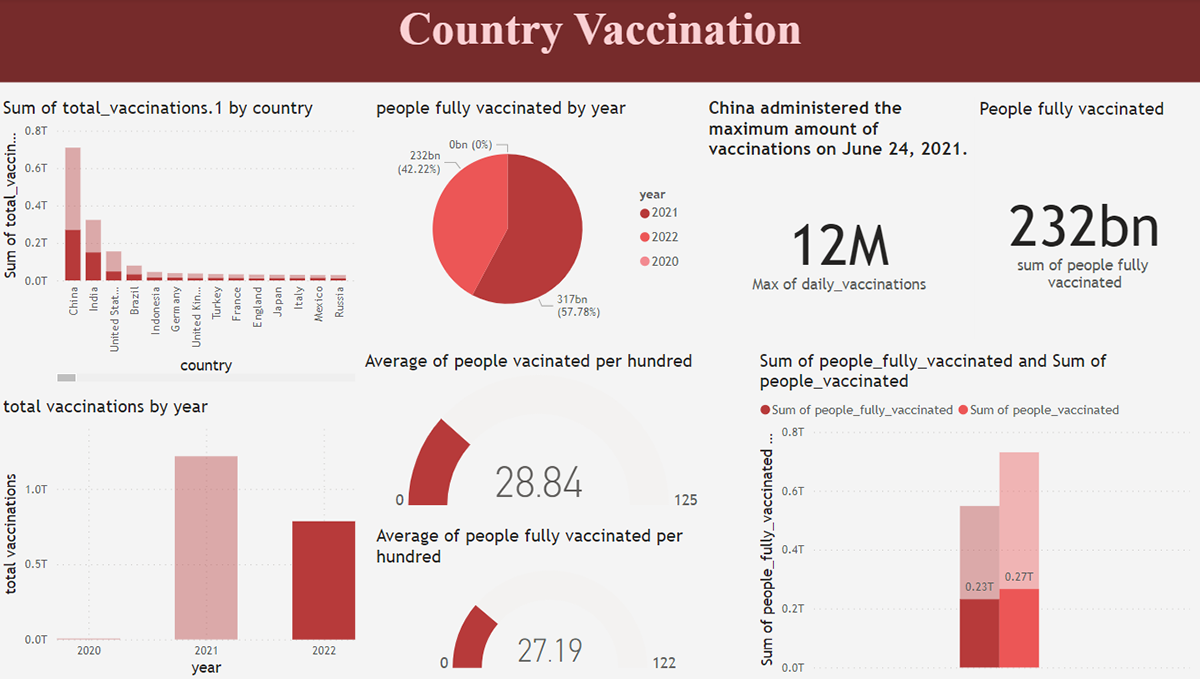
I worked with about 80,000 rows and 20 columns after downloading this dataset from Kaggle. I started by cleaning the data using Python pandas and numpy. I then ran multiple analyses using matplotlib and seaborn. Finally, I created a dashboard using PowerBI that summarises my entire analysis.

