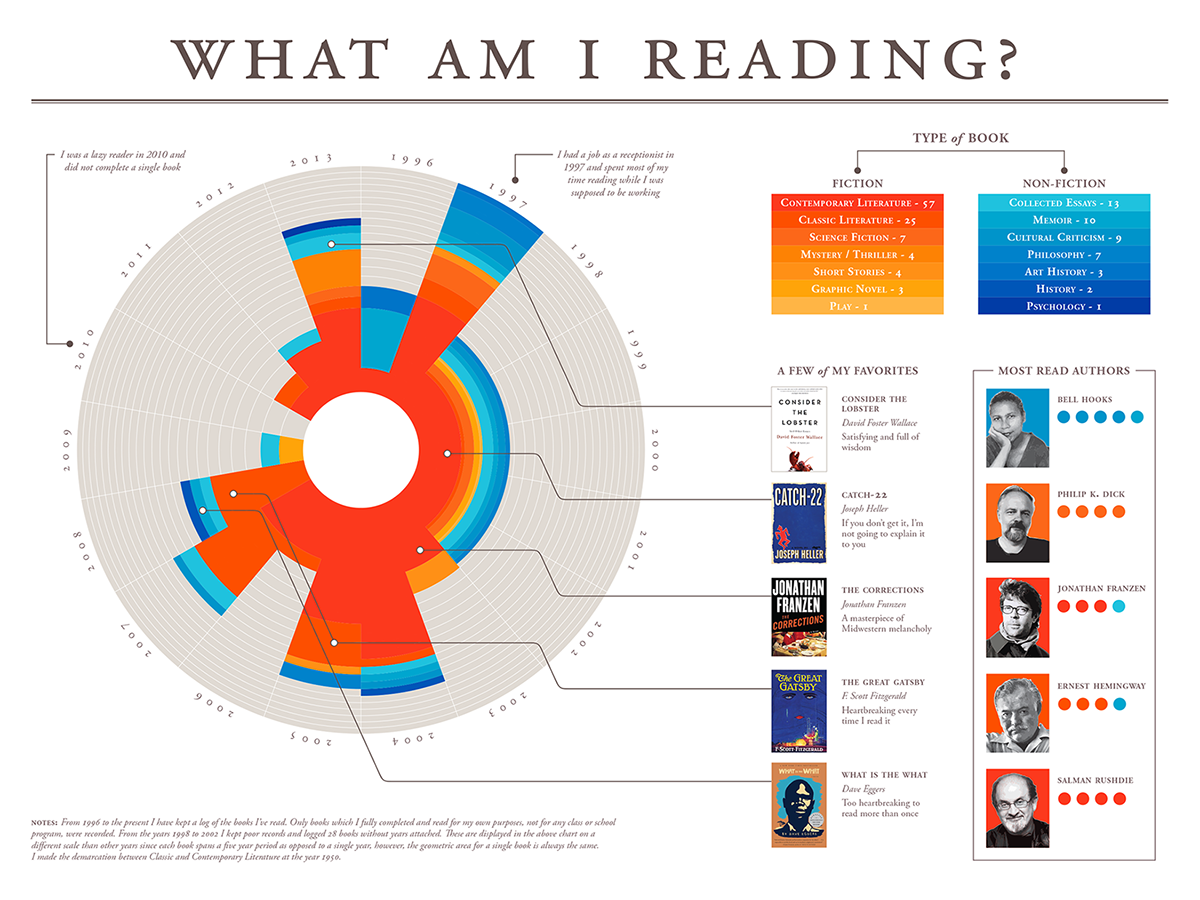
When undertaking a self-quantification project, I realized I had already been gathering data on myself for 18 years, writing down all the books I read as I finished them since 1996. I categorized the books by genre and displayed the data in a polar area chart (sometimes called a coxcomb chart). The area of each segment in the chart is equal to all the others even though their shapes differ, and each of these colored segments is equal to one book. I've also highlighted a few of my favorite books and most read authors.
Note: I kept poor records from 1998 to 2002, so these years are charted on a slightly different scale with one book spanning across a five year period, however the area for a single book is always the same.