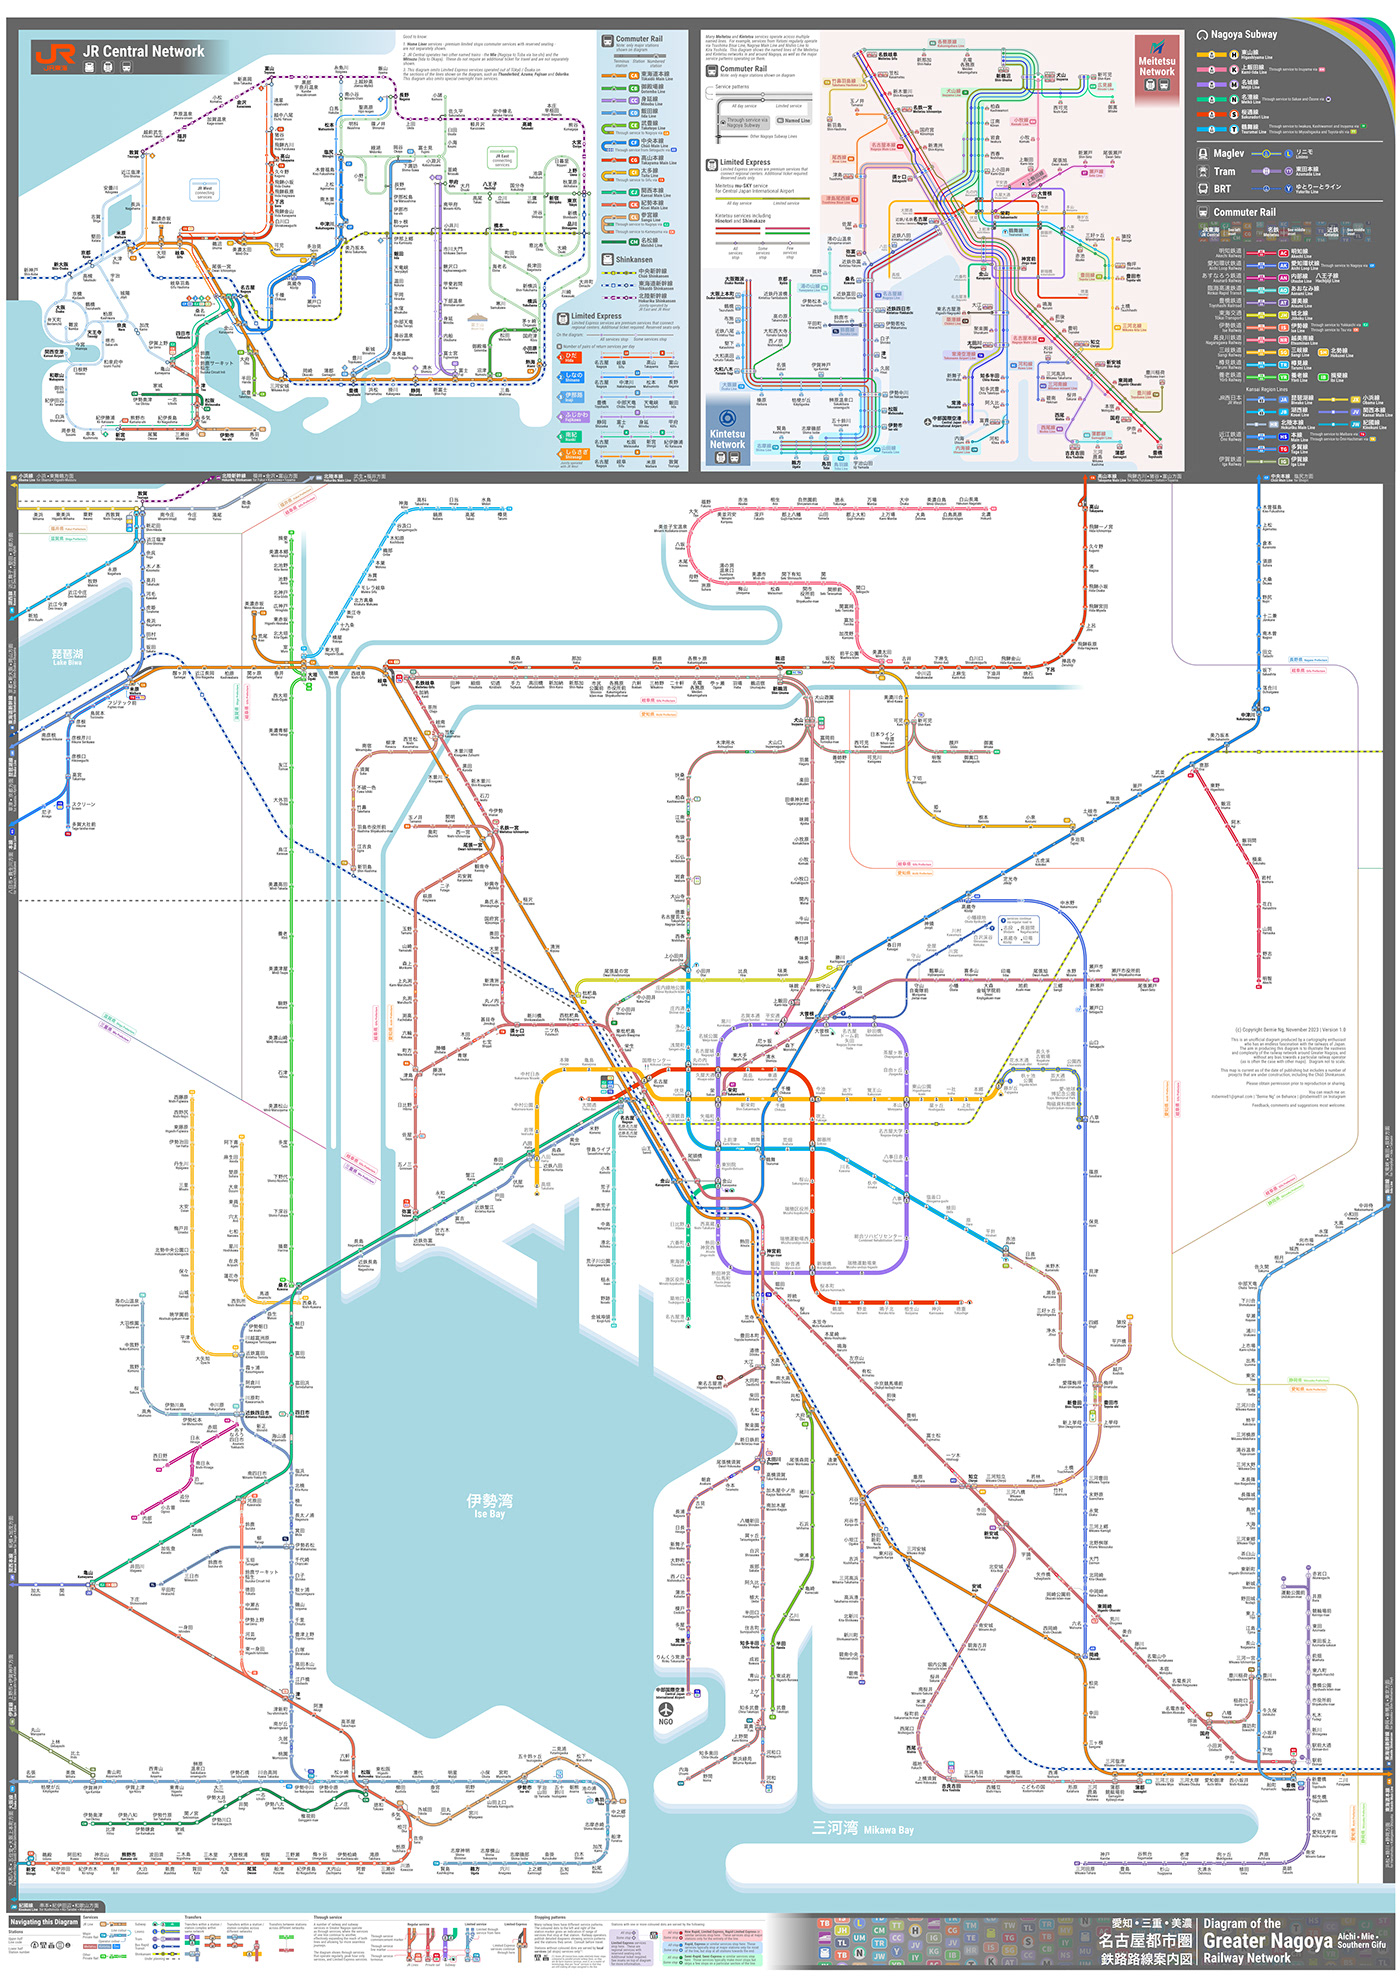
This diagram spans the urban areas and surrounding towns and countryside around Ise Bay and Mikawa Bay, which comprises the prefectures of Aichi, Mie and the southern half of Gifu (sometimes referred to by its ancient name of Mino). Besides Nagoya, the major cities in frame are Toyohashi, Yokkaichi, Tsu, Ise, Gifu, Takayama, Nakatsugawa, Maibara and Tsuruga.
The Nagoya Metropolitan Region is Japan's third largest conurbation, but it is often overlooked when put up against two much larger conurbations to its east and west - the megalopolises of Tokyo and Osaka. That's a shame, because Nagoya and its surrounds are filled with interesting things to see, do, eat and drink (indeed, same goes for much of Japan beyond the big cities!). Perhaps for similar reasons, even cartographers tend to be much more attracted to the size and complexity of Tokyo and Osaka's railway networks, but I have not seen many examples of diagrams depicting the entire railway network for Nagoya and surrounds. So why do we need such a diagram? Well, it's the same age-old problem - each operator releases its own network diagram which intentionally downplays (or completely omits) the routes and services of others. Ah. Challenge Accepted! The above is the result.
Nagoya's network is relatively simpler than its Tokyo and Osaka counterparts given its smaller urban footprint. There isn't the same dense network of railway lines that stretch out deep into suburbs. Nor are there other large cities besides Nagoya that have a sizeable railway network of their own (no equivalent of Yokohama, Kyoto, Kobe, for example). All this makes the shape, size and style of this network map a bit different. One of the major departures from my prior diagrams is the introduction of lines at 30 and 60 degree angles, in addition to the standard 0, 45 and 90. It is possible to adopt this more radical approach because Nagoya's network is far more concentric, with lines fanning out in all directions from the city centre, and the density of lines decreases markedly once you leave the city. The central spine around Nagoya Station is indeed oriented at a 60 degree angle, and to portray this spine at a 45 or 90 degree angle would have led to some unsightly compromises by way of unnecessary curves and uneven distribution of spacing.
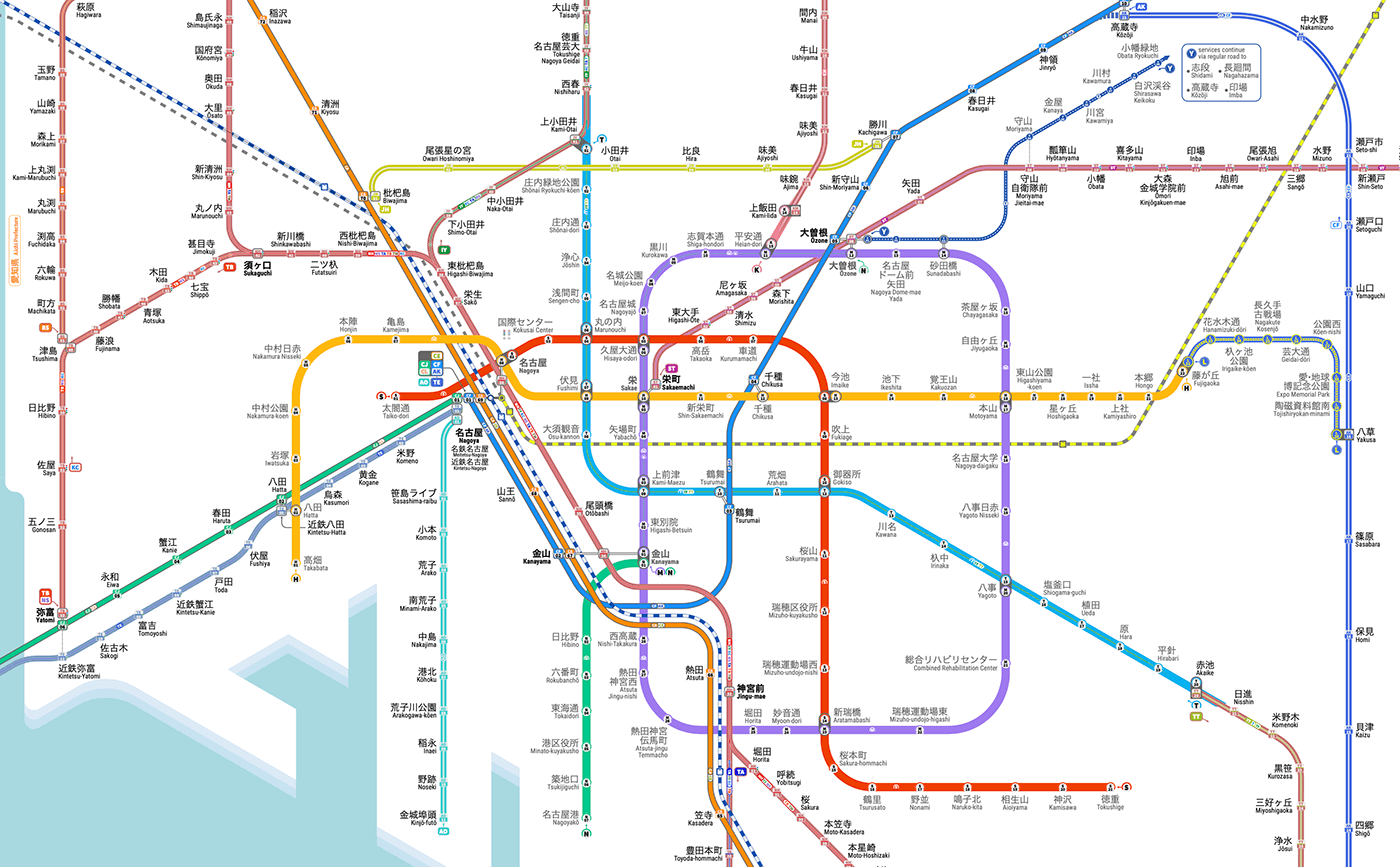
Detail from Nagoya city centre. Note the subway stations are represented by incomplete circles, which pays homage to the unique logo of the Nagoya Subway.
Speaking of city centre, Nagoya, like Osaka and Tokyo, does have a ring railway line of its own. Nagoya's takes the form of the Nagoya Metro Meijo Line. It is not as distinctive and iconic as, say, the JR Yamanote Line or the Osaka Loop Line. To give Nagoya's loop line some prominence, I sought to position it in the centre of the main diagram. I was not able to depict the line in more circular manner, which would have been more catching. I couldn't quite make that work, due to the complex interaction with the main railway spine on Meijo Line's lower right quadrant). In the absence of a visual hook at the centre of the diagram, which is something I like to include whenever feasible, I sought to give the diagram more personality by emphasizing the 30 / 60 degree spines, and by drawing the train lines at the hinterland in a way that frames the entire diagram.
In addition to the main diagram, I have included two auxiliary diagrams that show the three main railway networks separately - one for JR Central (JR Tokai), and another that combines the Meitetsu network, and the Nagoya section of the Kintetsu Network. These diagrams allow some additional information to be shown about the networks that I could not include in the main diagram without making that too complicated or excessively large. The JR Central diagram shows the entire JR Central network beyond the Nagoya Metropolitan Region including all of the Limited Express services, plus the Shinkansen network. It also shows the main commuter and conventional railway lines for the JR East network and the JR West network that connect with the JR Central network, putting the Nagoya-centric network in context of the Kansai network to the west and the Kanto network to the east. The Meitetsu / Kintetsu diagram shows the complex through service arrangements across different lines in place within each network, as well as the reach of the Meitetsu premium Airport express service to Chubu International Airport, called mu-Sky.

The entire JR Central (JR Tokai) network. A lot smaller than its JR counterparts to its west and east. JR Central operates the coveted Tokaido Shinkansen, by far the busiest (and very profitable) railway route in Japan. The Chuo Shinkansen, also to be opeated by JR Central, is also shown. The Shinagawa to Nagoya section was scheduled to open in 2027, but this has been deferred due to construction challenges in a section that runs under Shizuoka Prefecture.

The Meitetsu Network and the Mie / Aichi section of the Kintetsu Network. The aim of this diagram is to show the distinction between the names of lines given to the various sections of track, and show the services that operate on them. There is a very high degree of interoperation between the lines. Almost all Meitetsu lines that branch off the Nagoya Main Line, for example, will have at least some services that will operate to and from the Main Line and beyond. The diagram also shows the Limited Express services in operation.
The design philosophy for this diagram retains a lot of the original DNA from the Greater Tokyo Railway Diagram but also adds in some elements from the Kansai Region Railway Diagram (still awaiting completion...) plus new ideas of its own.
- Stopping patterns are shown by coloured dots to the right of the station marker, and I have retained the red / green / blue colour designation to differentiate between the different types of services. Limited Express services (i.e. longer-distance, intercity services) are denoted by a lilac diamond to the left of the station marker.
- Some sections of lines where direct through service is only provided by Limited Express services are shown.
- Consistent with the approach of the Tokyo / Kansai diagrams, private railway lines are shown with the lines of each company being the same colour. However, given the relatively few number of large-scale companies in the Nagoya area (i.e. Meitetsu and Kintetsu), it was possible to also show the line designation by a thin coloured stripe that runs in the middle of the line.
- All train lines with line codes, and all stations with station codes, have such information shown. I have in some instances chose to depart from the train company's naming convention. For example, JR Central likes to assign code "00" to the first station on the line, and I find that rather counterintuitive, so I have assigned "01" to the first station.
- With relatively fewer train companies and fewer lines to assign line codes, I have not carried over the approach in the Tokyo diagram of showing the operator code plus the line code. Instead, each line just has a unique code on the diagram.

How it all works
I hope you enjoy checking out this diagram. I'd love to hear your feedback, so please be in touch.

