A visual study on earthquakes in South America with a focus on Columbia
This paper represents the culmination of a three-month university project, dedicated to exploring the dynamics of earthquakes on a global scale, with a specific focus on South America and Colombia. Spanning 12 pages, the content unfolds across four levels—meta, macro, meso, and micro—each delving deeper into the seismic phenomena, supported by insightful infographics and maps.
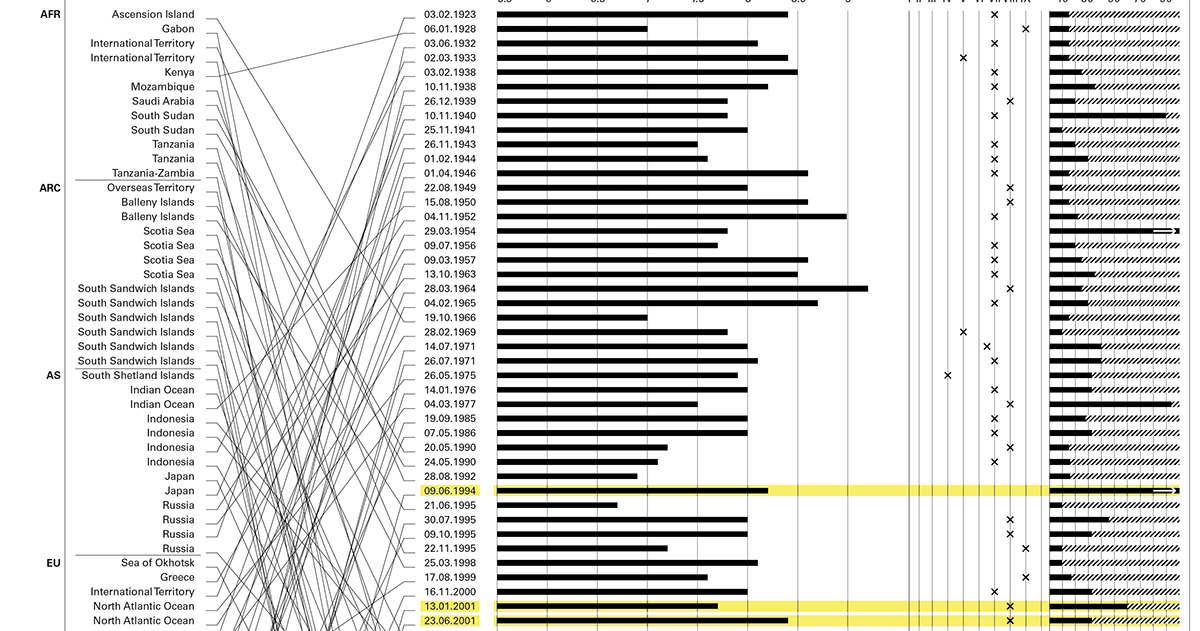
At the meta level, a global perspective is offered, presenting an overview of tectonic plate phenomena. The macro level narrows the focus to the 20 most powerful earthquakes in South America since 1900. Transitioning to the meso level, the intricate seismic activities of Colombia are unveiled, unraveling the geological complexities of the region. Finally, at the micro level, attention is honed in on a singular earthquake in San Agustin that occurred on September 30, 2012.
The collaborative nature of the project is reflected in the division of the class into seven groups, each representing a continent. Within these groups, individuals chose specific regions and earthquakes to visualize. As a result, the class produced a comprehensive 160-page document elucidating the natural phenomena of earthquakes, elucidating relevant terminology, and, most importantly, simplifying access to this complex subject through information graphics and maps.


The concluding page of the work is dedicated to encapsulating the human experiences associated with earthquakes, visually portrayed through typographic representations. Drawing on quotes and firsthand accounts from the analyzed earthquakes, as well as insights gathered from family, friends, and acquaintances, this section provides a poignant reflection on the personal impact and significance of seismic events.

Thanks for Watching!
The project was developed during the "Data Visualization: Mapping & Visual Analysis" course at New Design University in the summer semester of 2023.
For more insights in my projects follow me on instagram: @Naomi.hinkelmann
For inquiries or potential collaborations, feel free to reach out by sending a message to design.hinkelmann. Looking forward to connecting!