- Visual storytelling of a scientific study -
The poster series 1-4 visualizes the empirical scientific field study I was implementing during my Ph.D. studies in 2013. The reader is guided through the steps of this study and can follow how scientific research in order to evaluate the different affected elements of climate change is carried out.
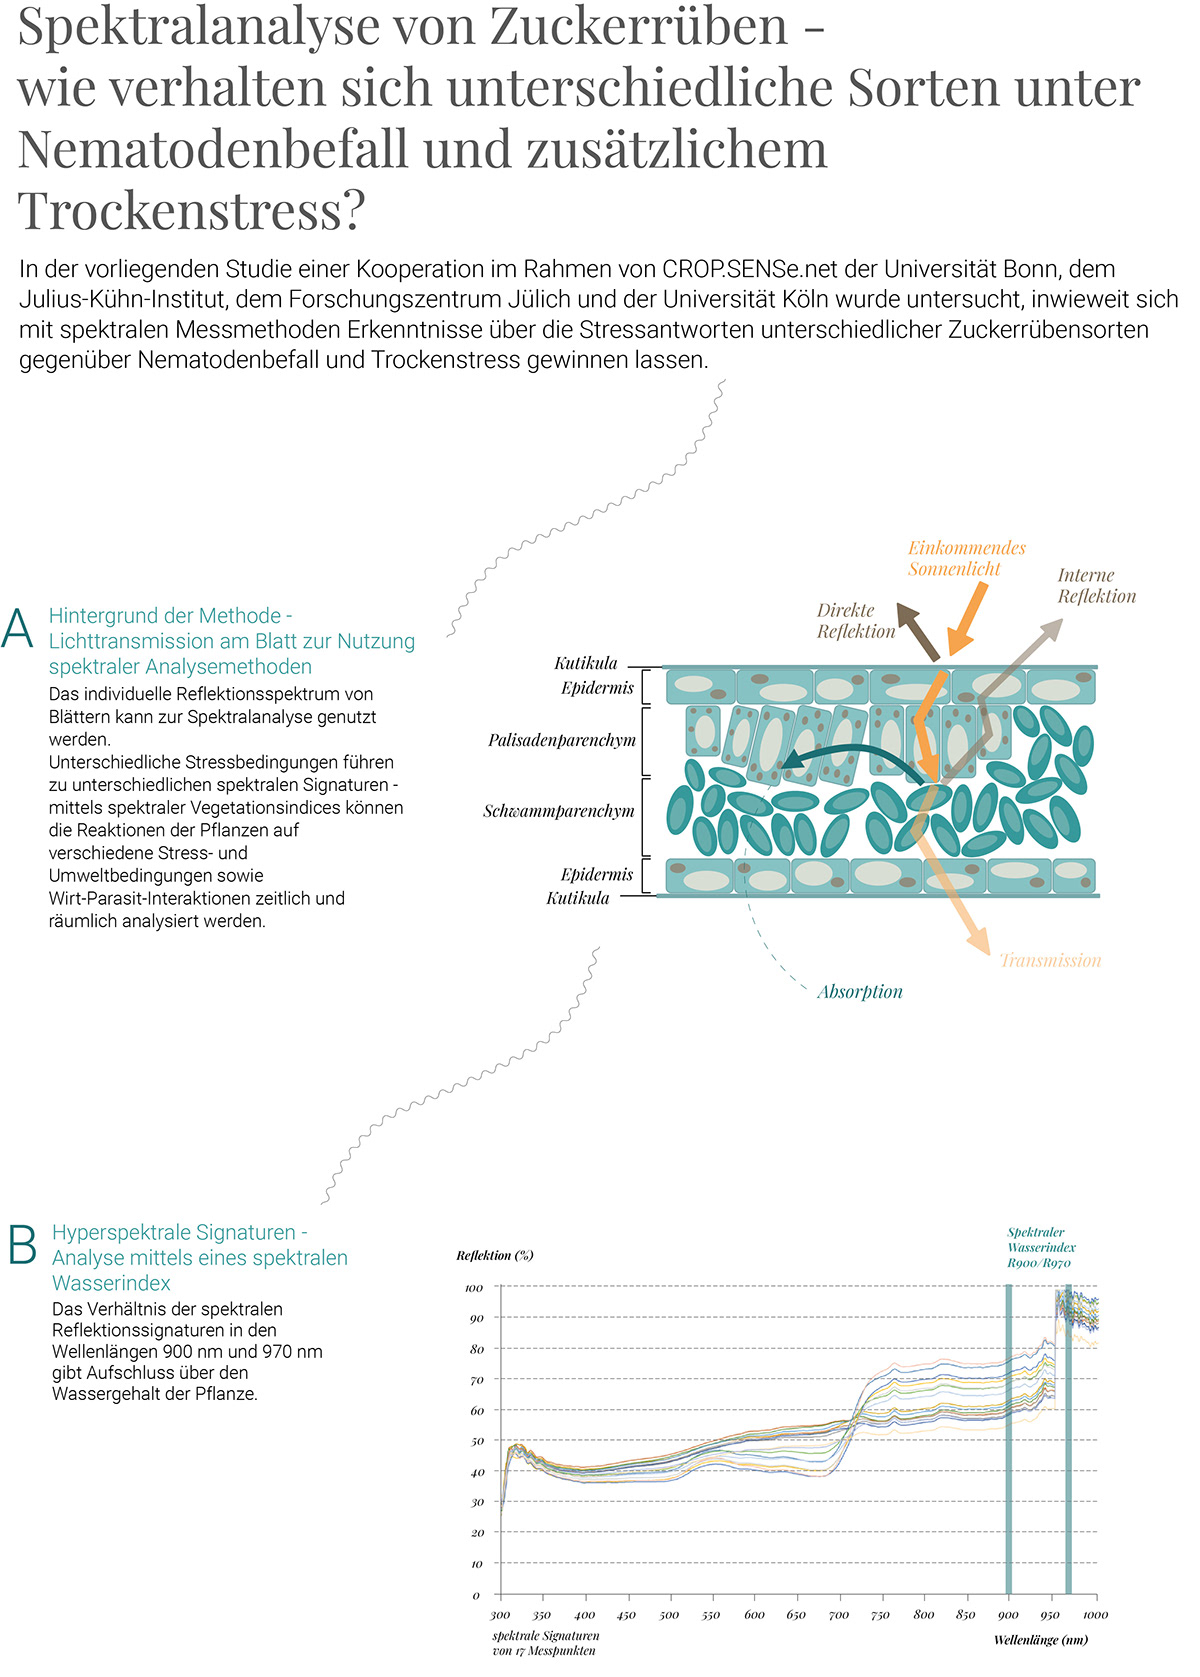
This scientific agricultural field study aims to evaluate the spectral profile of different sugar beet varieties during drought stress and parasite infestation with a focus on the spectral Water Index.
The data was first analyzed with Excel and then prototyped with RAWGraphs and edited with AdobeIllustrator.
The isometric illustrations are performed with AdobeIllustrator and are based on the data analysis.
Overview
Presentation of the poster series 1-4.
Poster 1
Introduction to the research topic and explanation of the approach of data analysis.
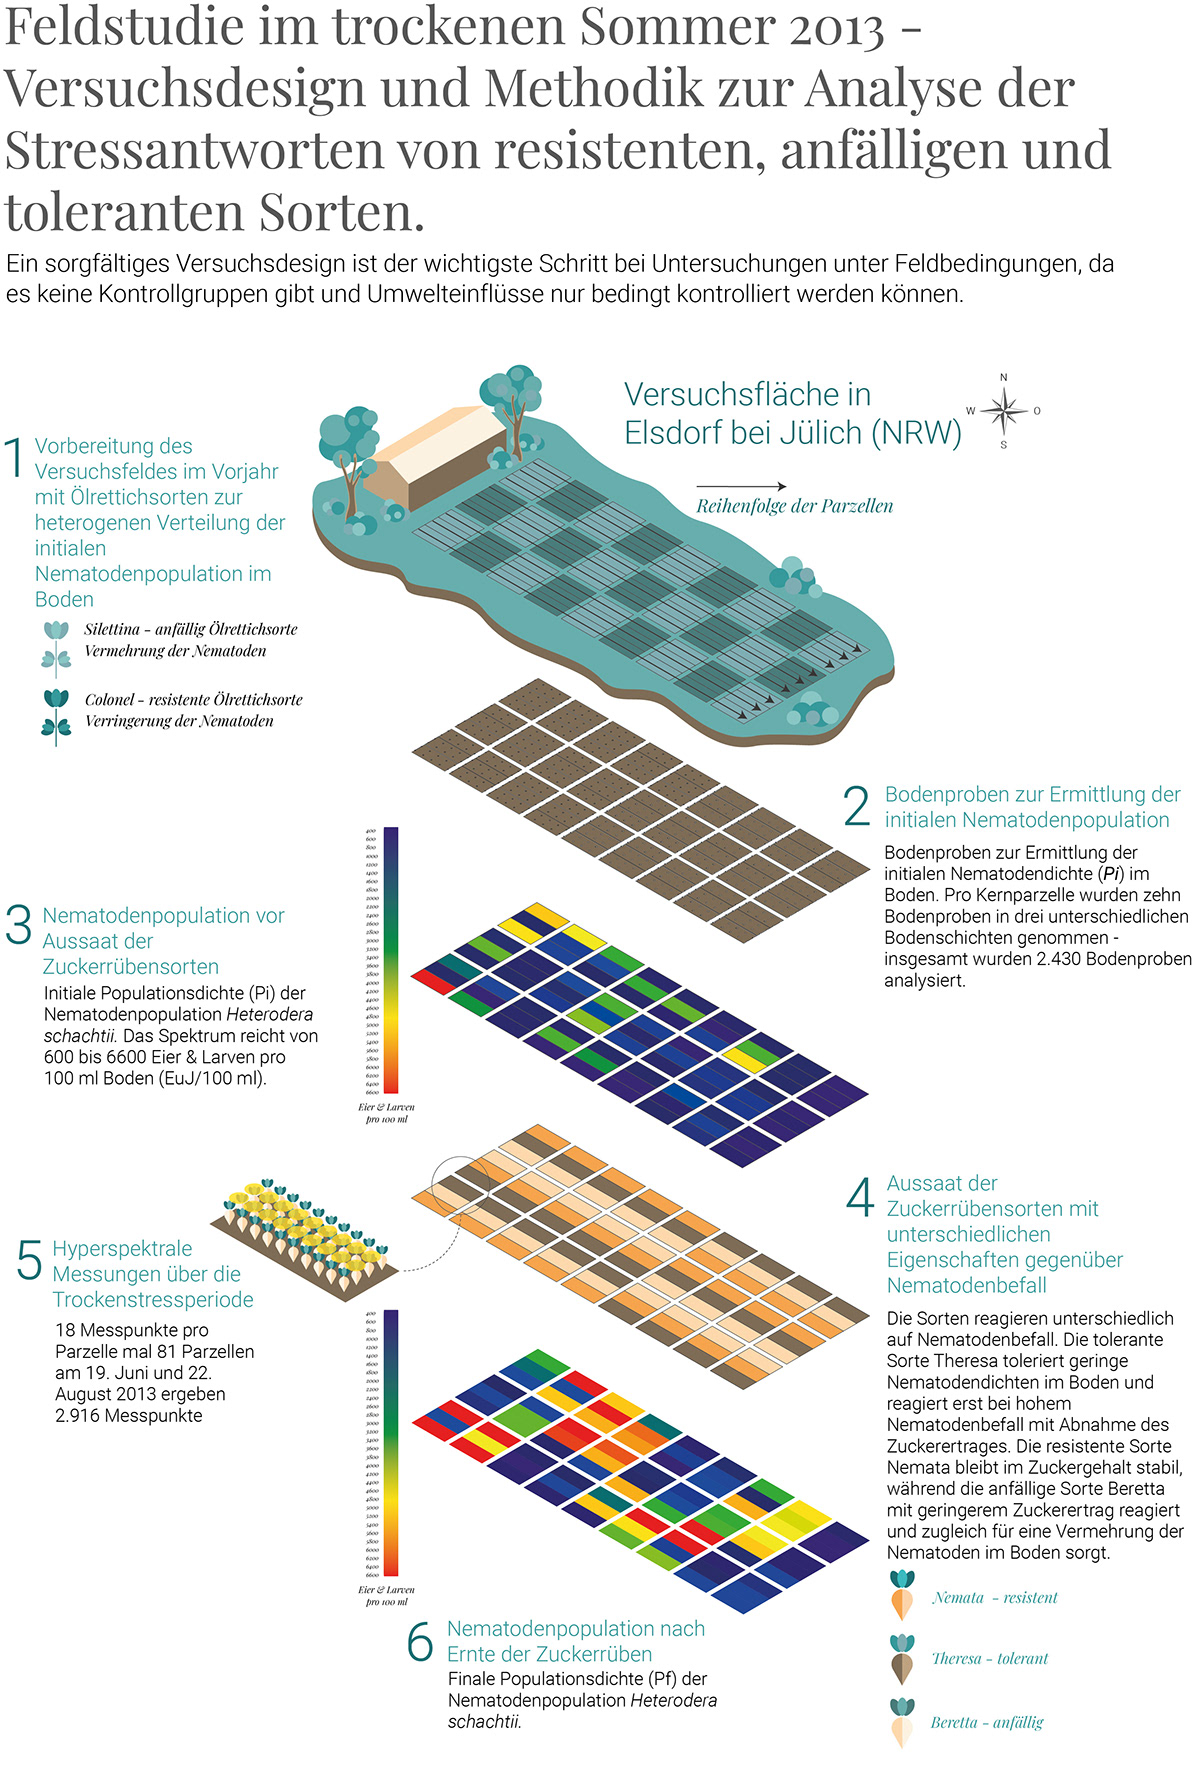
Poster 2
Infographic of the field study and the steps of each data sampling process.
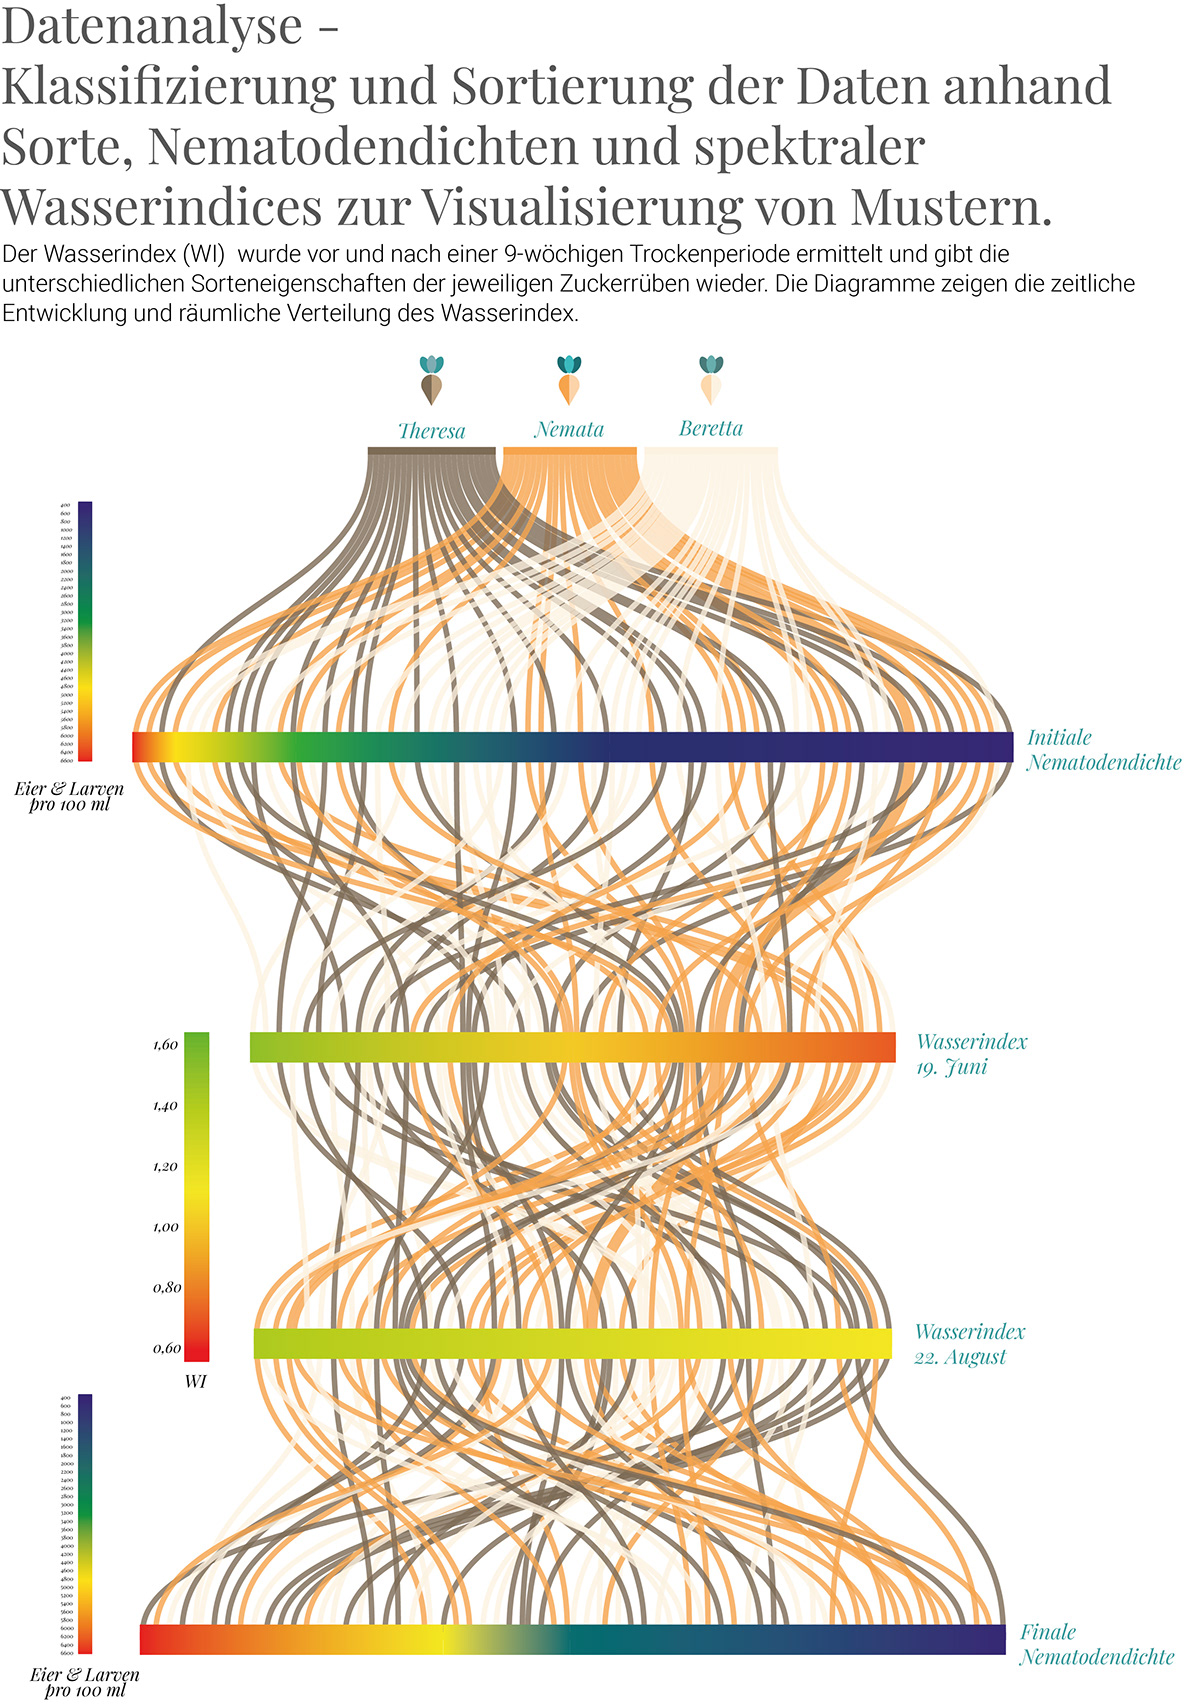
Poster 3
Graphic data visualization of the data analyzing process by sorting and classifying the collected data.
Poster 4
Graphic visualization of the final evaluation and conclusion of the results.