The Westernization of Japanese Culture: The Story
Instructor: Joseph Quackenbush
Term: Spring 2014
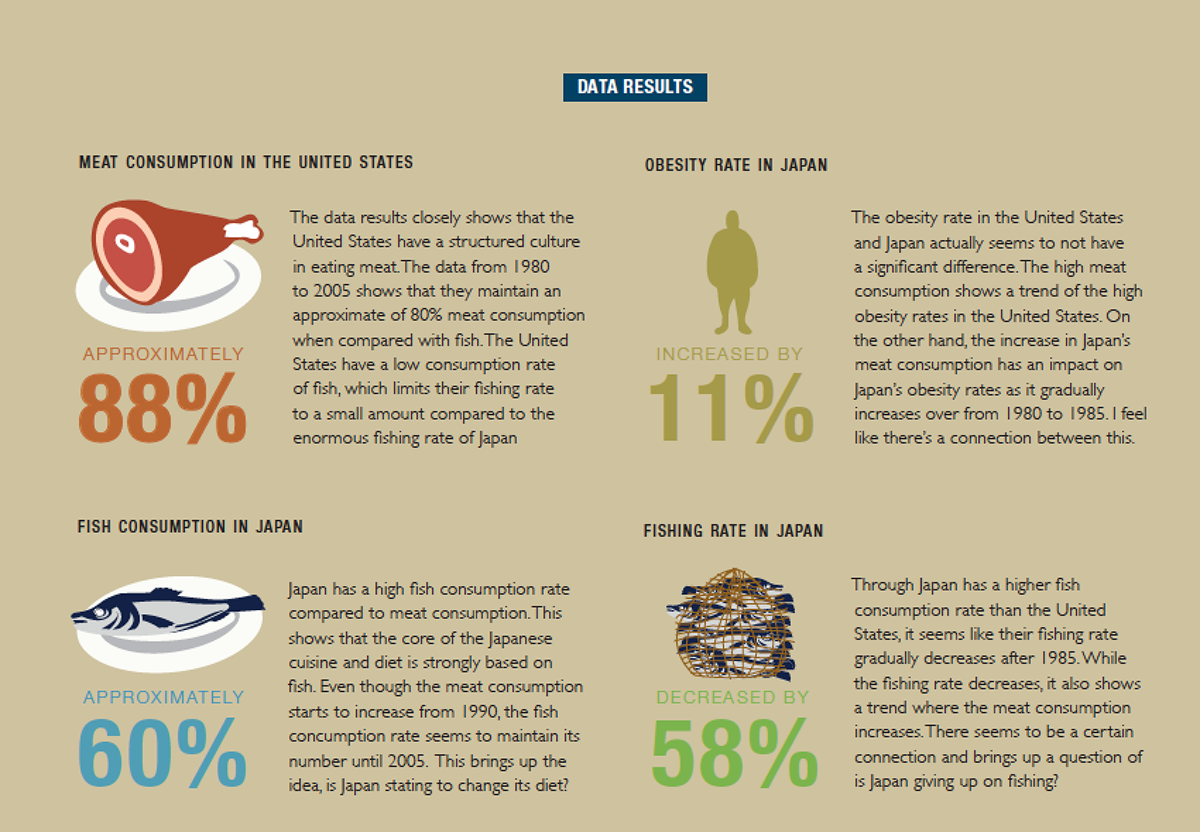
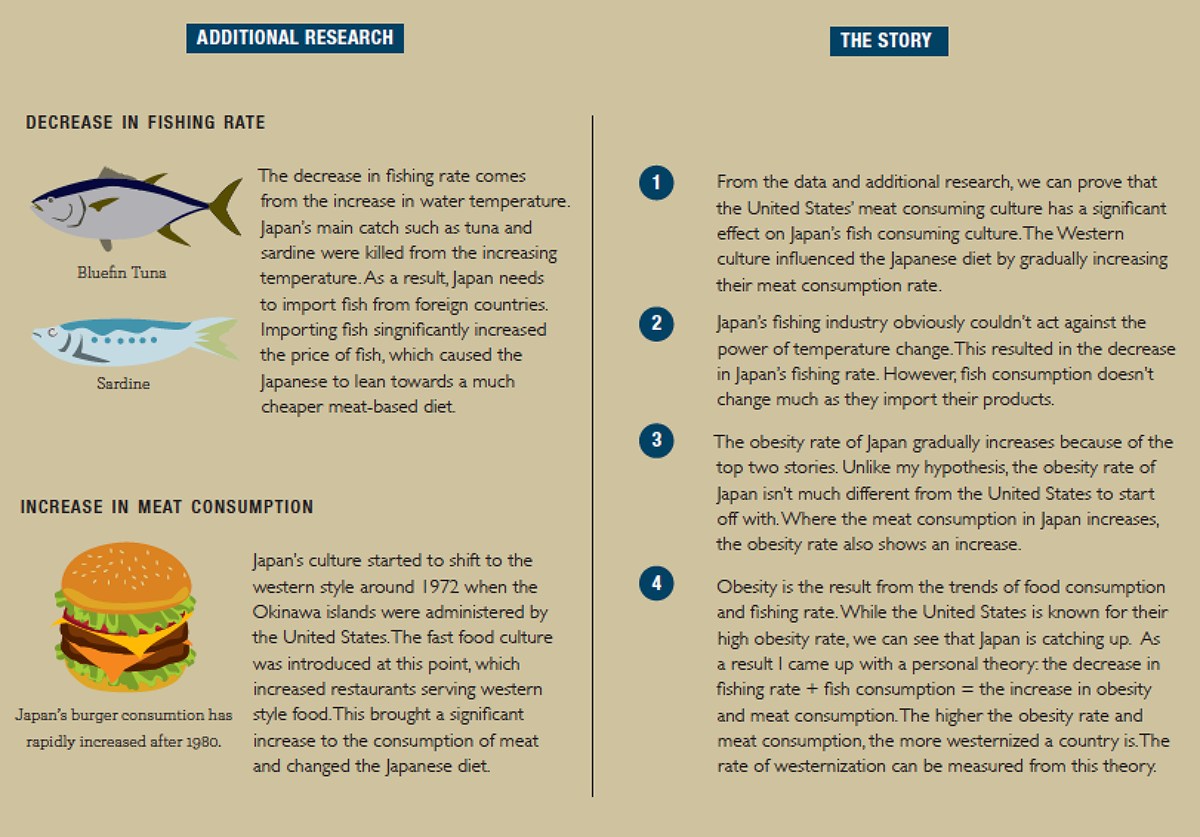
What is data? This project explores the power of data and how various sets of data can create a powerful story. I chose to work with different types of datasets including meat consumption, fish consumption, fishing rate, and the obesity rate of Japan and the United States. The data set created a unique harmony of telling a story of how Japan becomes westernized through a certain period of time. While the project brief didn't specify us to create an infographic, I chose to take this route as it projected my personal process, data, and conclusion.
Instructor: Joseph Quackenbush
Term: Spring 2014
What is data? This project explores the power of data and how various sets of data can create a powerful story. I chose to work with different types of datasets including meat consumption, fish consumption, fishing rate, and the obesity rate of Japan and the United States. The data set created a unique harmony of telling a story of how Japan becomes westernized through a certain period of time. While the project brief didn't specify us to create an infographic, I chose to take this route as it projected my personal process, data, and conclusion.
...............................................................................................................................................................................................................................................
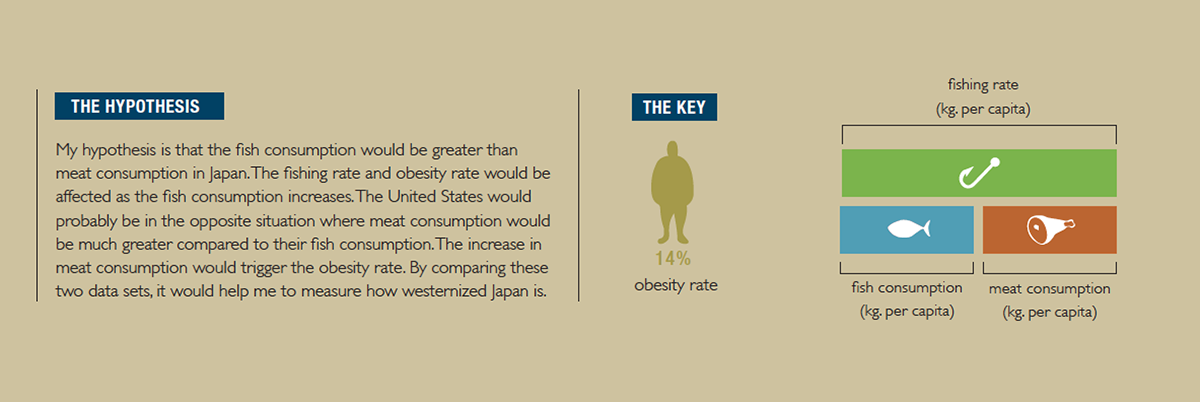
The Poster starts with my personal hypothesis towards my data set and also a key to let the viewer understand what they ware looking at in the infographic.
...............................................................................................................................................................................................................................................

...............................................................................................................................................................................................................................................
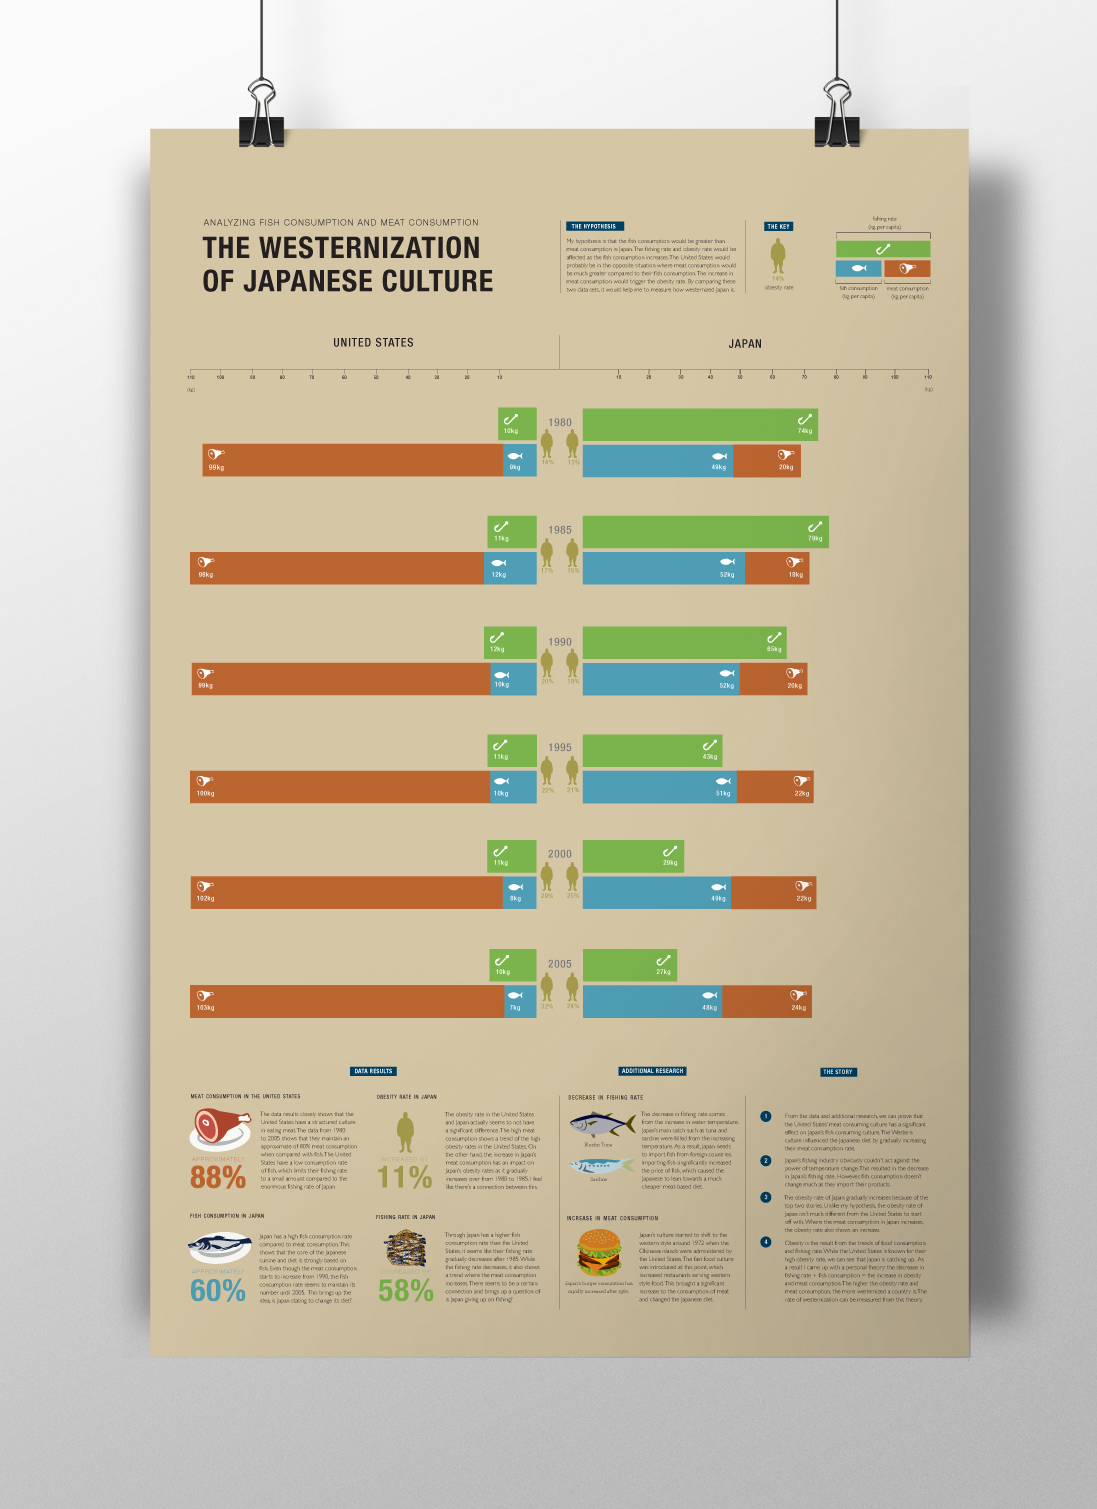
My data set is divided from the years 1980 to 2005. Each data is divided into two columns (Japan or USA) and in two rows (fishing rate & fish vs meat consumption). The data was created in a sideway bar graph style to make my findings more clear and understandable to the viewer.
...............................................................................................................................................................................................................................................