Information Graphics
Starting with a convoluted graph from the Washington Post I redesigned the information in a way that was both simple, and conformed to the constraints of the original design.
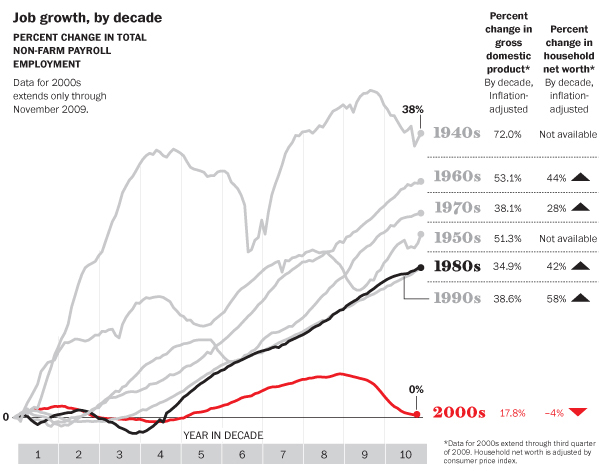
Original (Washington Post)
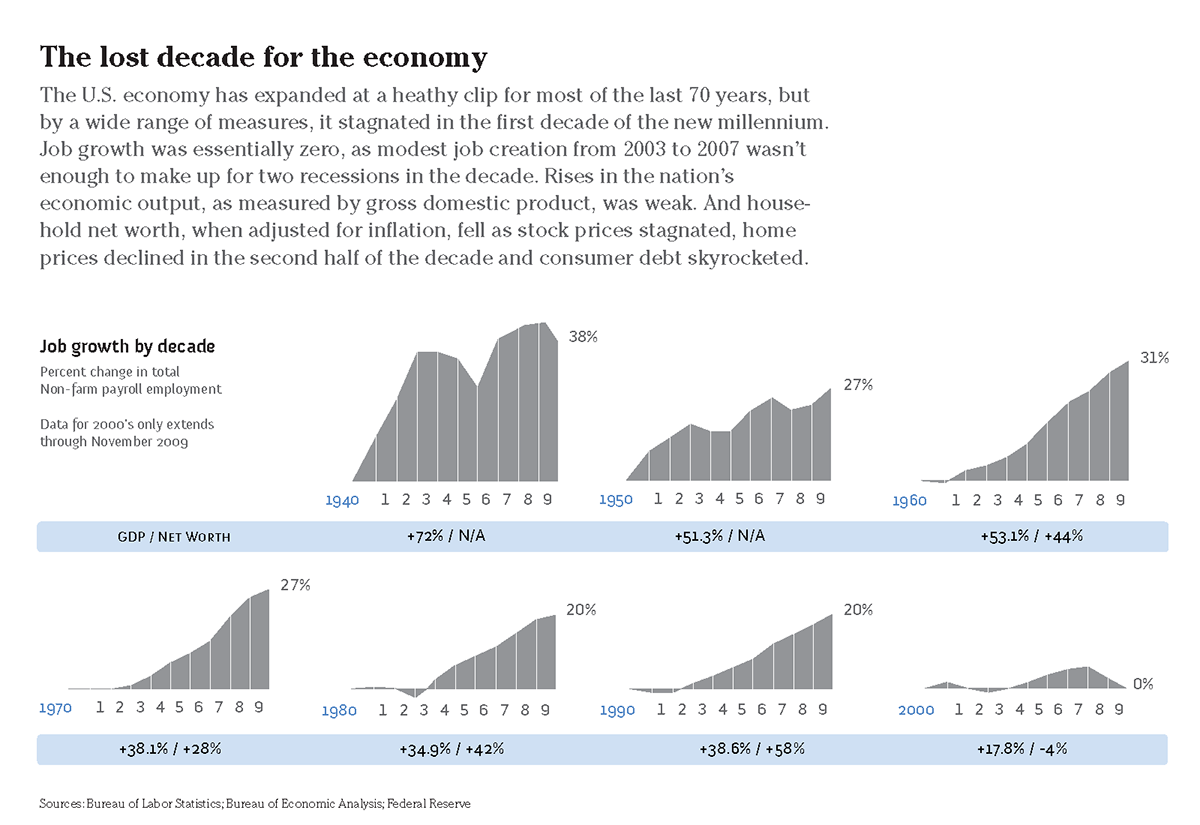
Redesign
Pollution is a very hot topic these days, but which countries are the biggest contributors to the issue? Taking recent statistics the following graph aims to make it very obvious who is most responsible.
