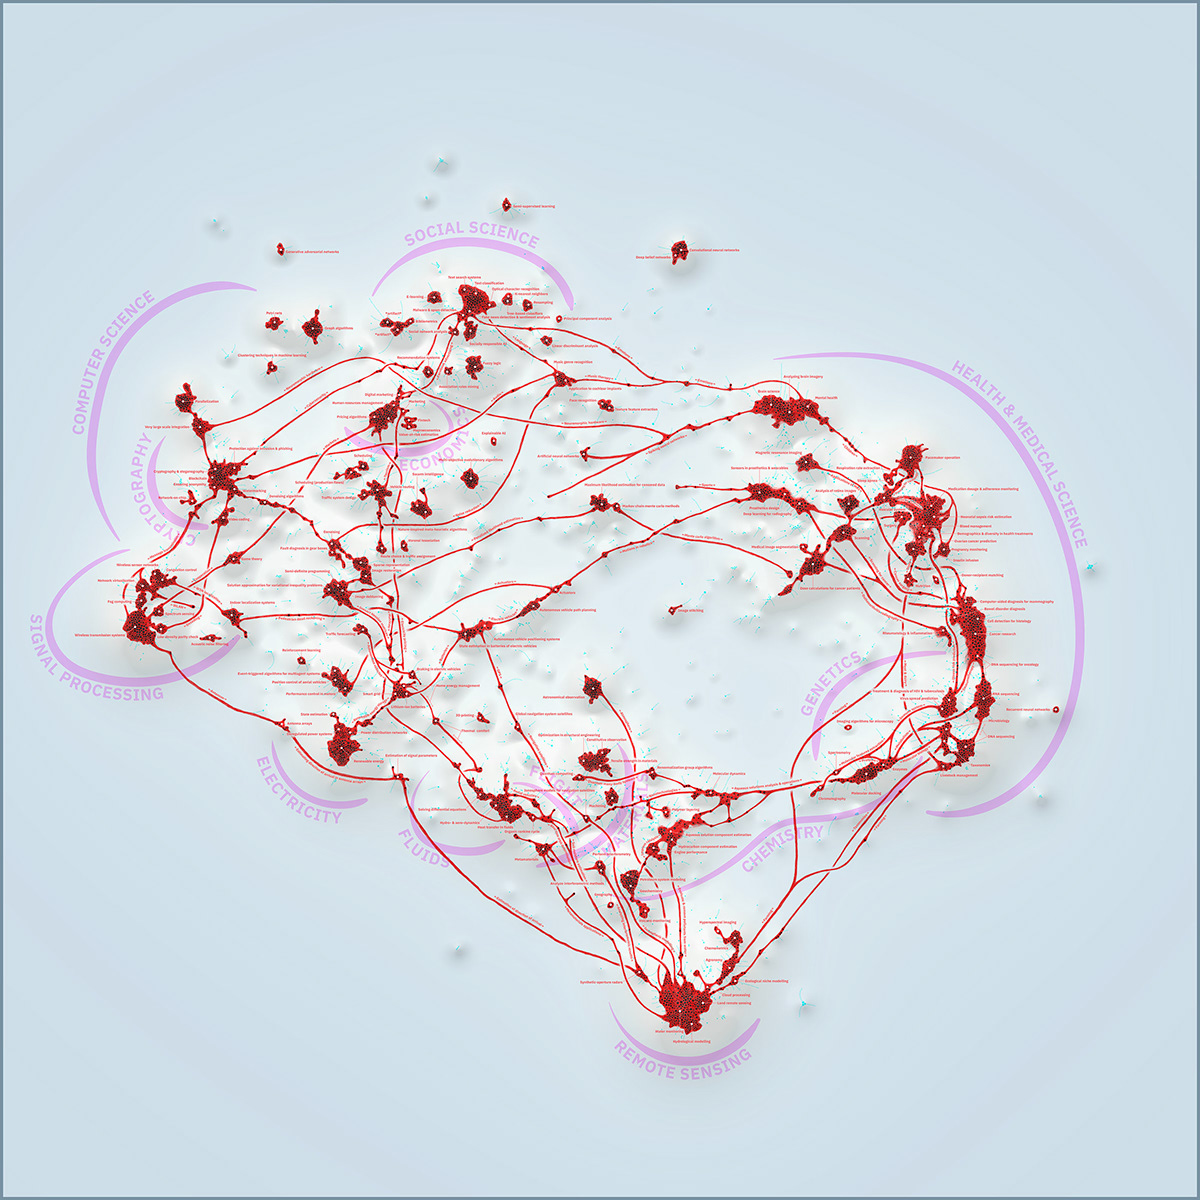
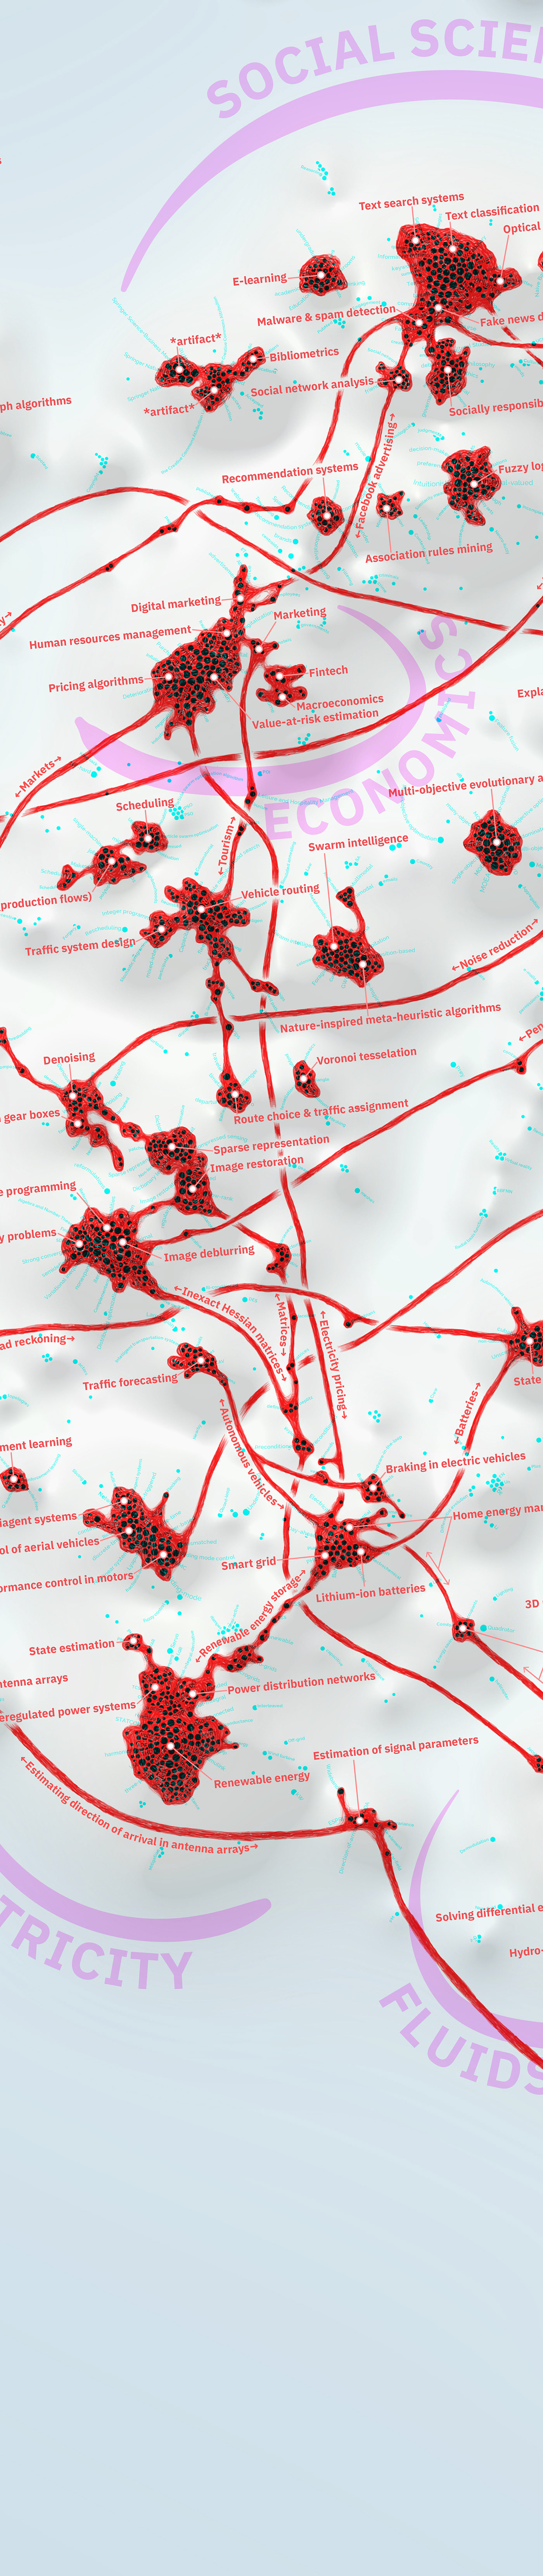
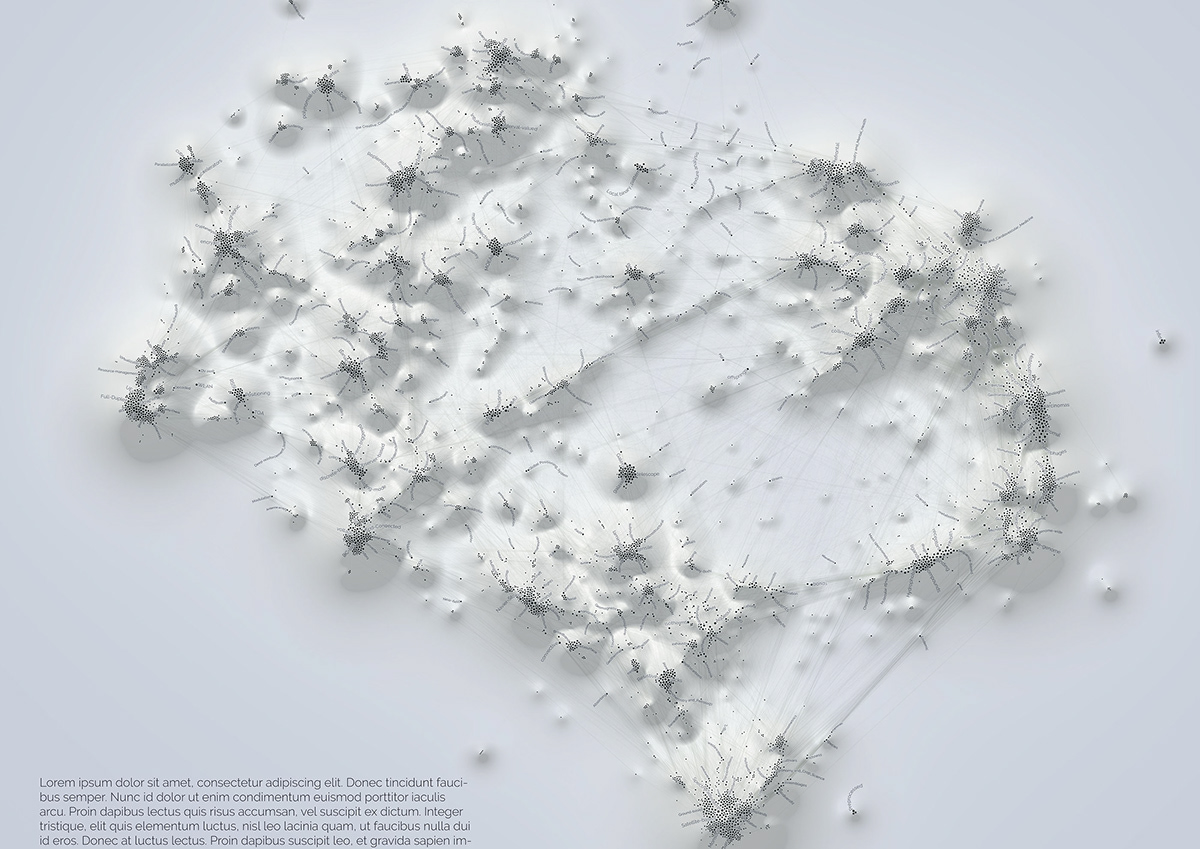
A map of what algorithms are doing in science and technology.
7500 expressions extracted from the abstracts of 1M scientific publications about algorithms, machine learning, and artificial intelligence.
The expressions are mapped as a co-word network where each node is an expression and an edge signifies co-occurrence in the same article. Only the 85K edges with highest Pointwise Mutual Information have been kept. The less connected nodes have been omitted, so that each node kept has at least 4 neighbors.
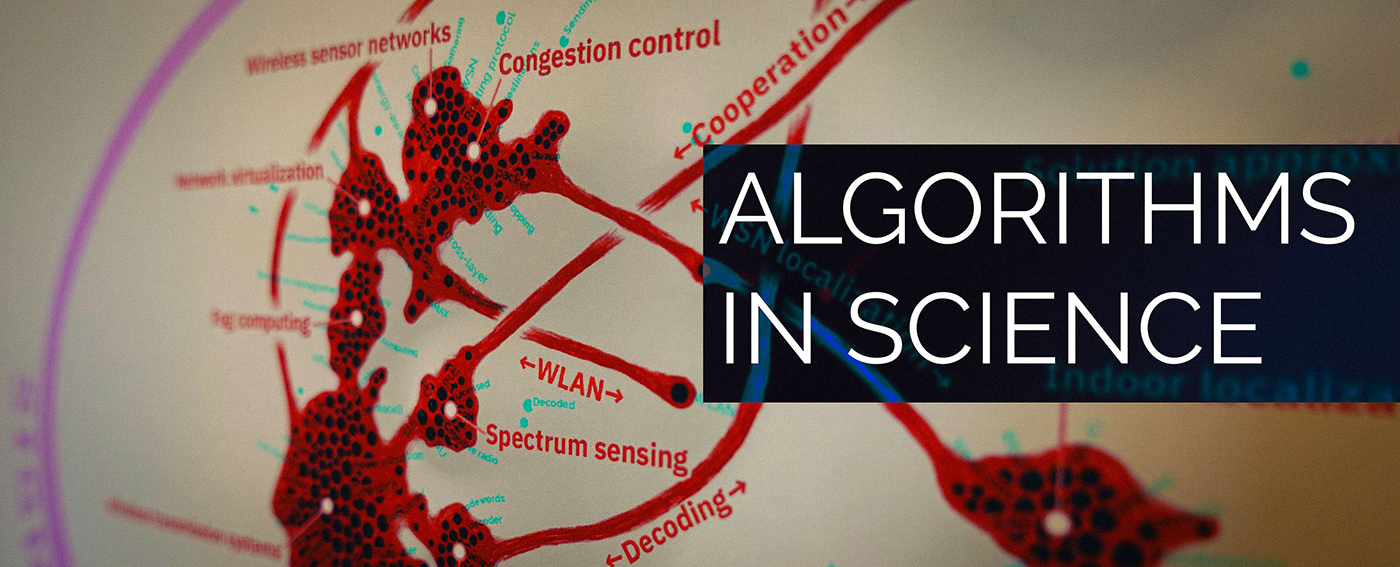
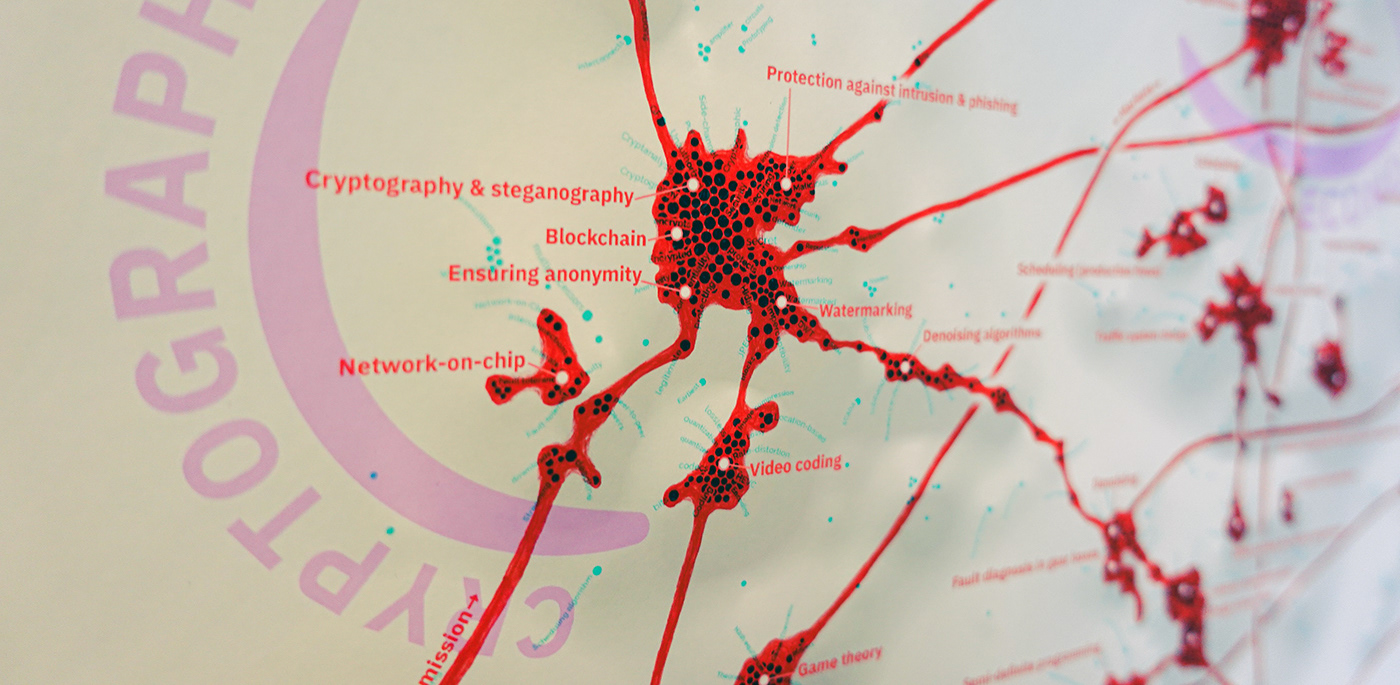
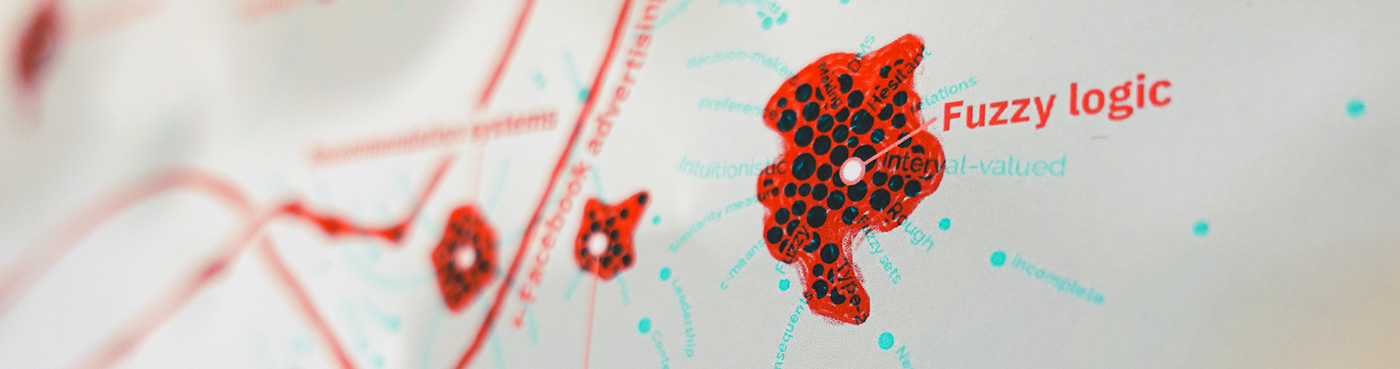
The co-words network is represented in light blue. The expressions are represented as dots, with a label if there is enough space to display it. The edges have been omitted, but they were taken into account in the layout. Expressions that co-occur more are placed closer.
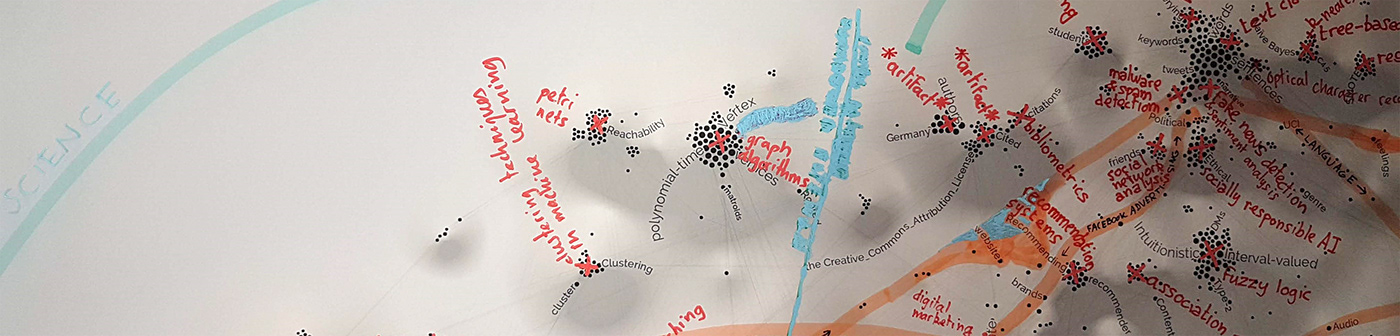
An annotation layer has been overlaid. The large pink annotations are the general topics. In red, each label corresponds to a set of articles with a shared set of expressions. If those expressions are in the same place, the label points to that place. If the expression spreads over or between multiple places, the label is placed along a bridge between those places.
Produced in the Tantlab by Mathieu Jacomy, Matilde Ficozzi, Anders Kristian Munk, Johan Irving Søltoft, Torben Elgaard Jensen and Snorre Ralund.
ANAGLYPH LAYERS
The original data (expressions from the scientific abstracts) and the annotation layer (named clusters and bridges) are both visible at the same time. Using anaglyph glasses and blinking from one eye to the other, one can focus on one layer or the other.
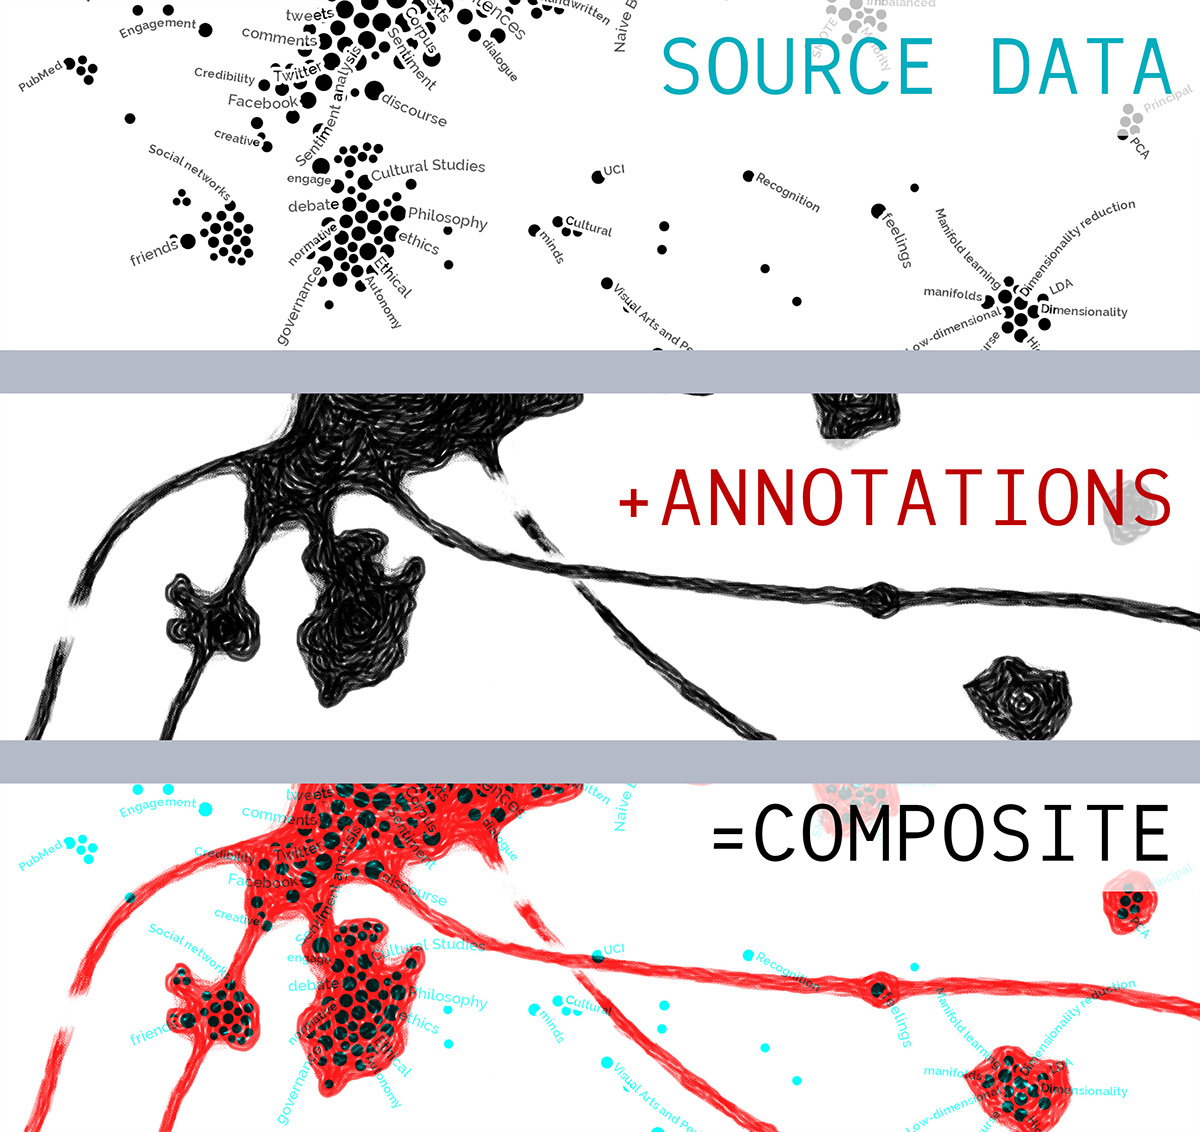
This data visualization quotes the source material, in the sense that it remains accessible to the person who reads the map. They have the opportunity to challenge the annotations (red) by double-checking the words they are grounded in (cyan).
WORKFLOW

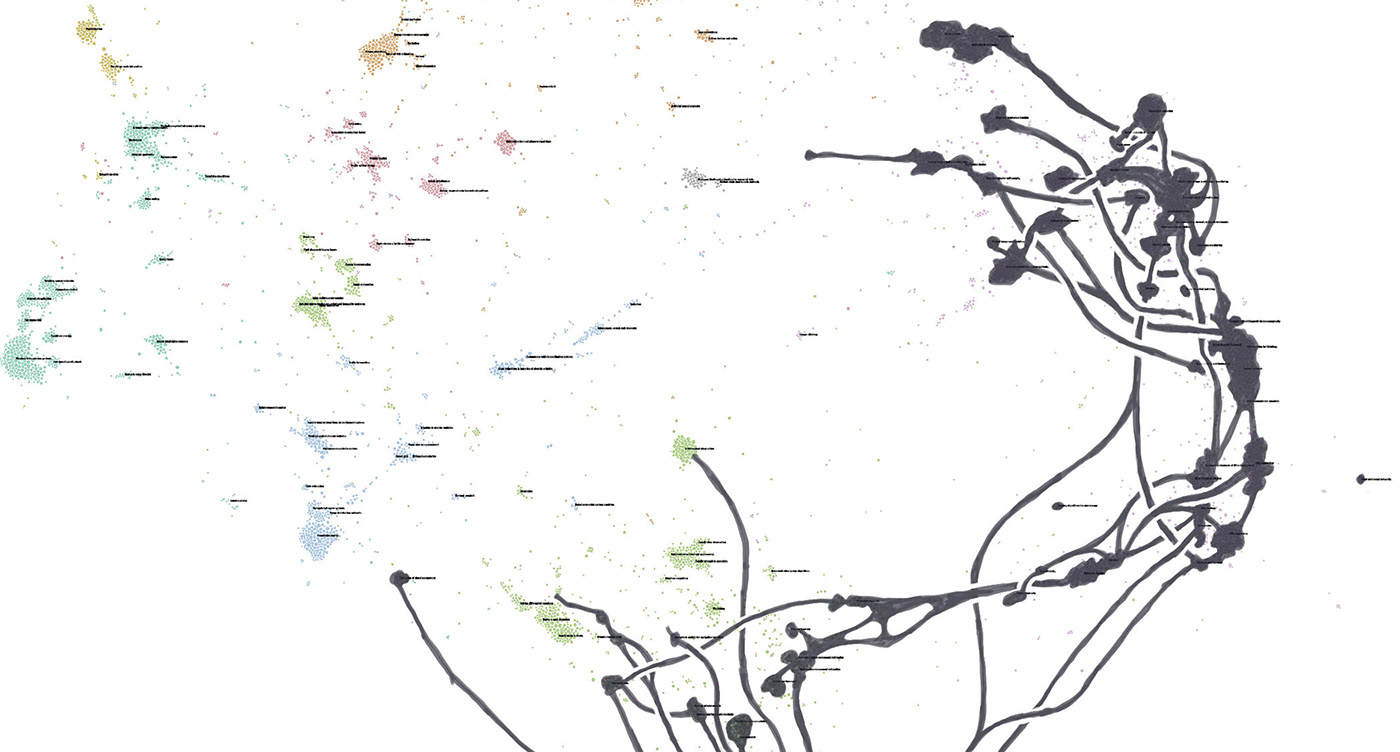
Original network in Gephi
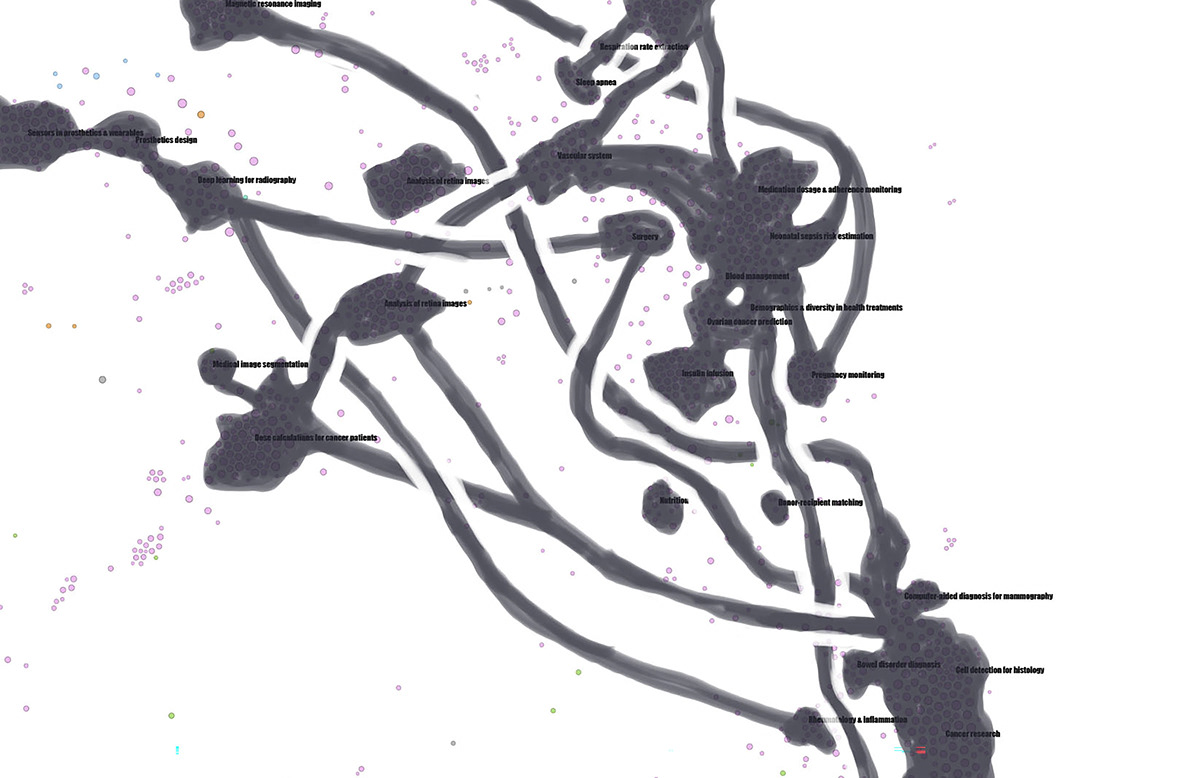
Rendering for annotation
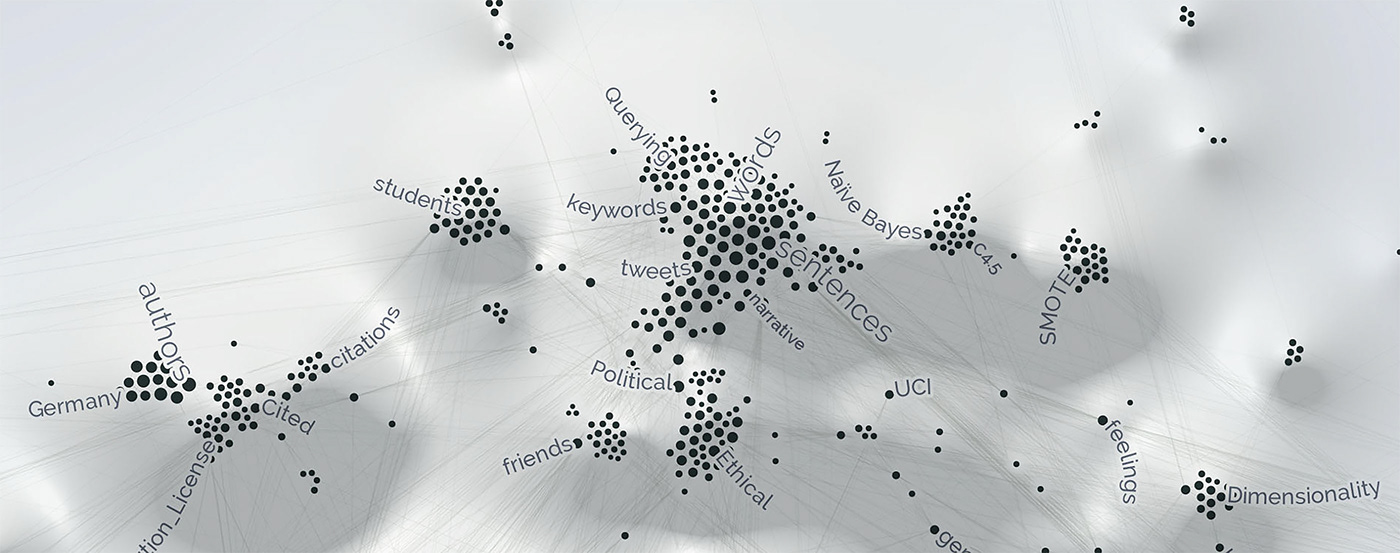
Closeup of the rendered visualization
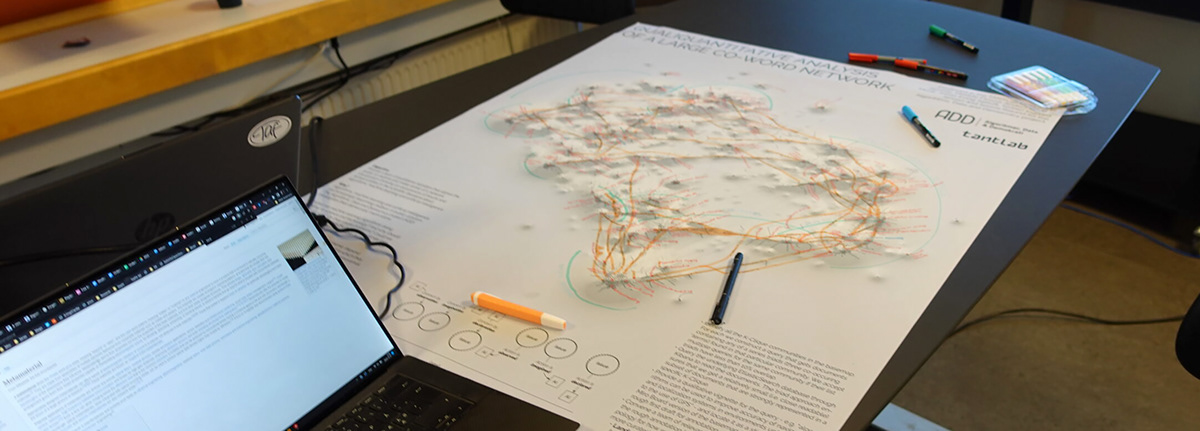
We annotated the map manually, on paper.
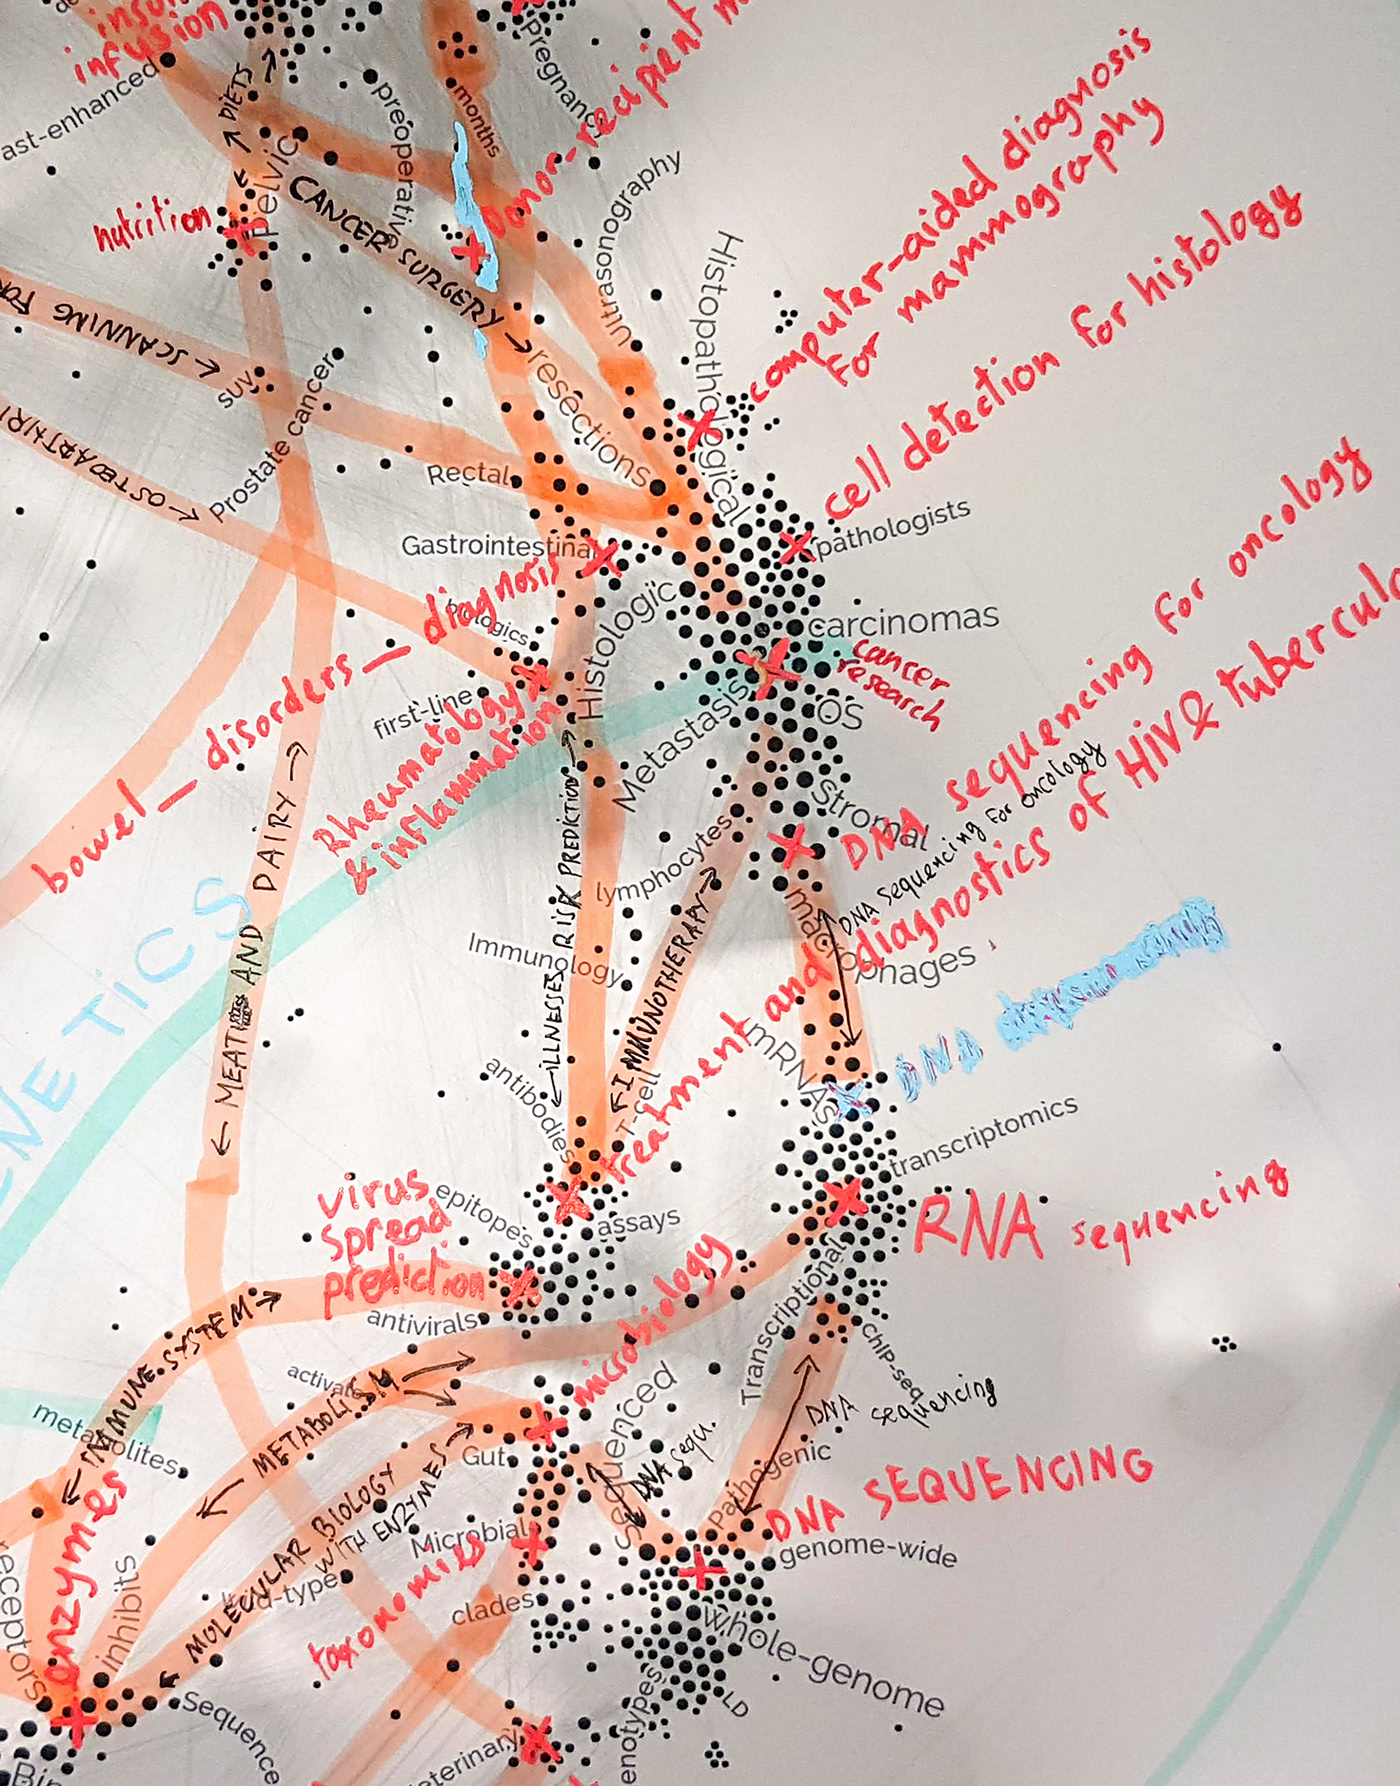
The annotations were messy. It was our first draft.
We recoded the landmarks and the bridges as a unified color layer.
We paid attention to improve the readability of the entangled bridges in the most dense areas of the network.

The recoded layer was then redrawn with more details by double-checking the source material (original network). Some clusters were added at this stage.
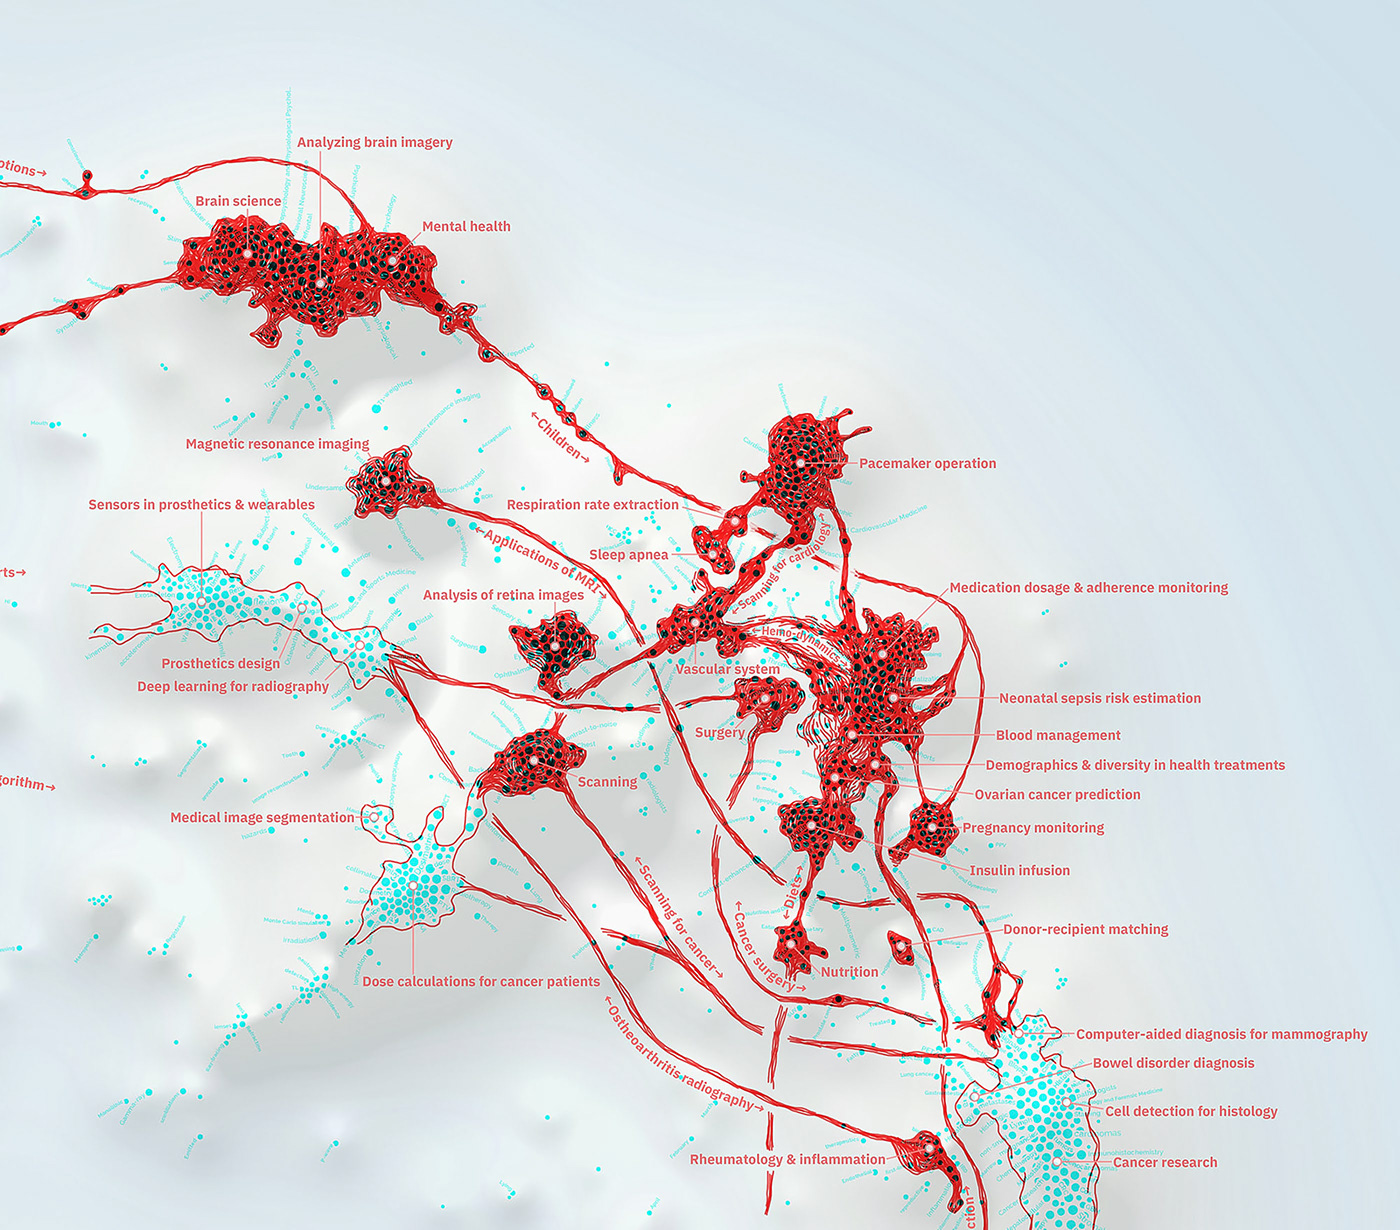
Final layer, work in progress.
MORE INFO
You can learn about the process of coding the topology visually in this post:


