Resource Management
01: Overview
Version 1.0, Updated January 2023 using Octane 2022.1 and C4D 2023.1.3
About This Guide
This is the beginning of an ongoing series on the exciting world of resource management!
The goal of this series is to explore what C4D and Octane are doing under the hood, and how to tune our system resources and habits to make our workflow as zen and frustration-free as possible.
Part 01 (this one) is a high-level overview of how C4D and Octane work together and use the various hardware/system resources we have at our disposal. Part 02 is a rollup of all of the findings from the rest of the series, and each part after that is a deep dive into a particular area.
Guides in this series
· 01: Overview <--This one
· 02: Findings Summary
· 03: Polygons
· 04: Instances
· 05: Textures
PDF
This guide is also available in📄PDF format here.
I. Intro
Resource management is one of those important things that takes some time to fully understand. After getting a handle on it, you’ll begin to understand what to look for in new hardware purchases, as well as what techniques to try to use or avoid at any cost while building each scene.
This first part explains a bit about how the whole system works, and which hardware resources are used to do what. After that, we’ll go into what we’re going to track in the rest of this series, the tools we’re going to use to track said metrics, get a baseline of our testing hardware, and finally do a deep dive on a few key concepts.
Testing system
We’ll be using a 2021 Razer Blade 15 for these guides. Specs: i9-11900H CPU/64GB RAM/RTX3080 Laptop GPU/16GB VRAM/4K 60Hz OLED. OS: Win 11 Home 22H2. Cinema 4D 2023.1/Octane Render 2022.1
Test scenes are 1280x1280, 30FPS. All unnecessary apps and processes have been shut down.
II. Crash course in how it all works

A Cinema 4D file (.c4d) lives on the hard drive. This stores the general scene information like settings, lights, cameras, etc. It also contains data for all the objects in the scenes - polygons (both baked and generated), textures (procedural and links to external images), and any other generated, stored, or linked assets like volumes or dynamic caches, etc.
When the file is loaded into C4D, all of this stuff is copied into the computer’s system RAM because it’s MUCH faster than working with those assets on the hard drive. Depending on the size of the stored data, and the speed of the hard drive, RAM, and CPU, this is either nearly instant or can take a little while (main culprits are tens millions of polygons or high res/bit depth textures).
Once that’s done, all the generators run and produce polygons or textures on the fly using the CPU, and then the output of those generators are also stored in RAM.
During this time, Cinema 4D also updates the viewport(s) as objects are being manipulated or the camera view is moving around. This is done using the GPU and some VRAM, and it’s measured in Frames per Second (FPS). The higher the FPS, the smoother the viewport feedback appears (to a point - we’ll get into this later). The CPU also has to keep up with this as things change. If it’s taxed or too slow, it can’t process changes to the objects in the scene fast enough, the FPS drops. If it goes down too low, it starts feeling choppy and laggy. This is annoying while working, but also makes timing animations impossible when hitting play on the timeline.

When it comes time to render, Octane first makes sure that all the generators run and bake out the necessary geometry and textures. It bundles the output of that with the linked textures, already baked polygons, scene data, and anything else it needs into a neat package, and then attempts to copy it all into VRAM.
VRAM is extremely fast memory that has a direct line to the GPU. If there’s enough VRAM to contain all of the scene data, there might be a little pre-processing time as the generating and copying is done, but after that, Octane will render at full speed using the GPU.
If there isn’t enough VRAM, Octane will try to offload some of the chunks of polygons or textures to a reserved block of system RAM called Out-of-core. This will slow the rendering process down, but it’ll still render.
If the Out-of-core memory is exceeded, Octane will throw up a message saying it can’t render because it’s out of memory (or crash, depending on what else is going on).
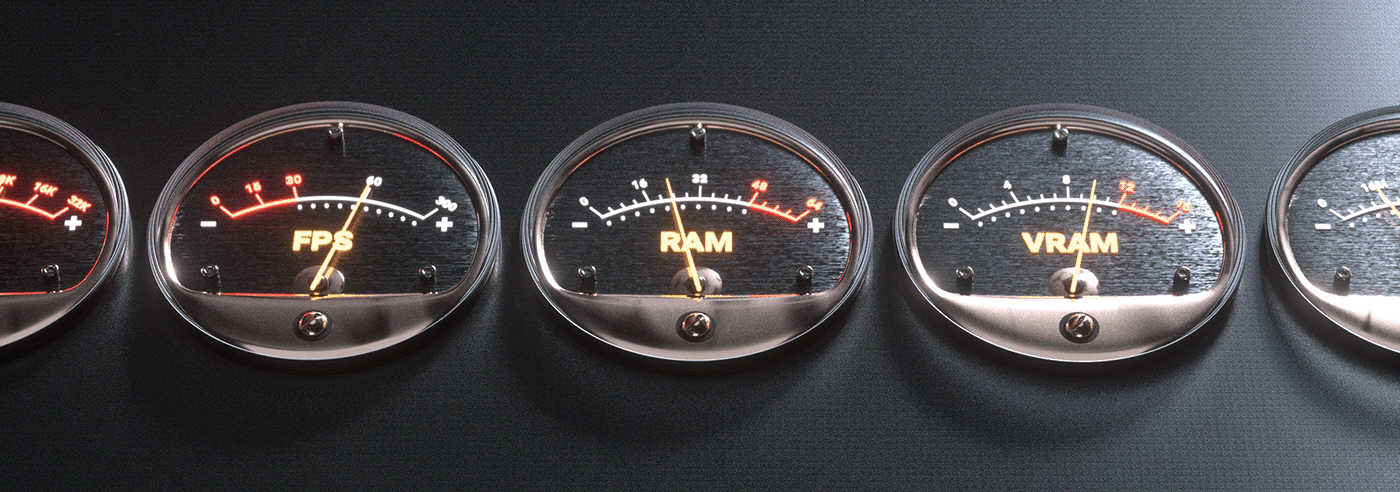
III. What we’re going to track
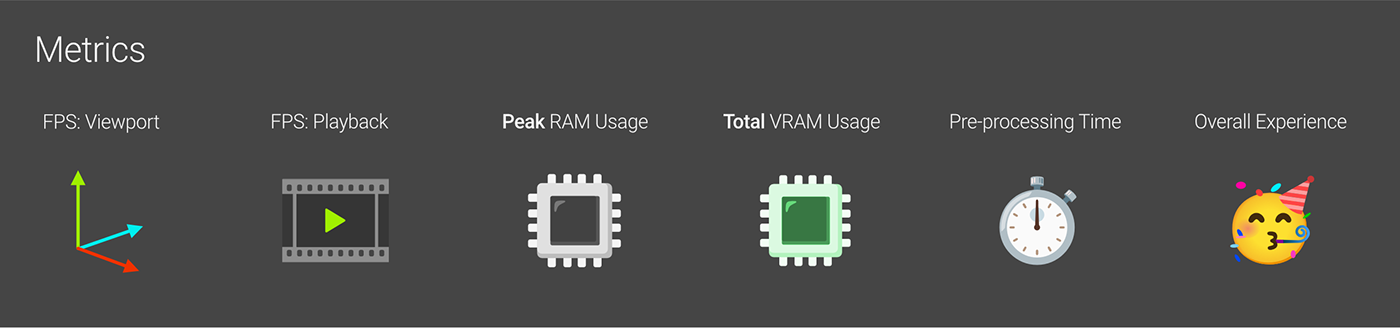
Before we even send the scene to render, we’re mainly going to be concerned with the framerate (measured in frames per second or FPS for short) in the viewport during both navigation and playback as a measure of how responsive C4D is.
We’re also going to look at the RAM and VRAM usage both before and during the render. RAM is very temporary and fluid, so we’re mostly concerned with peak usage and making sure it doesn’t max out if possible. VRAM is more rigid - things tend to go in once, get used for a specific purpose, and then get flushed out, so we’ll look at total VRAM usage.
Pre-processing time is the time taken to generate/triangulate/package/copy all the data before we can even start rendering. This determines how long we have to sit around and wait before we can see a render start to happen.
Finally, there’s the overall experience which is a subjective metric that tells us how easy or painful the process is.
We’re not going to worry about render times themselves in this series. We’re more worried about clearing the runway for the renders so nothing is bogging them down before they even had a chance to start.
IV. Tracking Tools
Now that we know what we’re after, how do we find all this information?
FPS
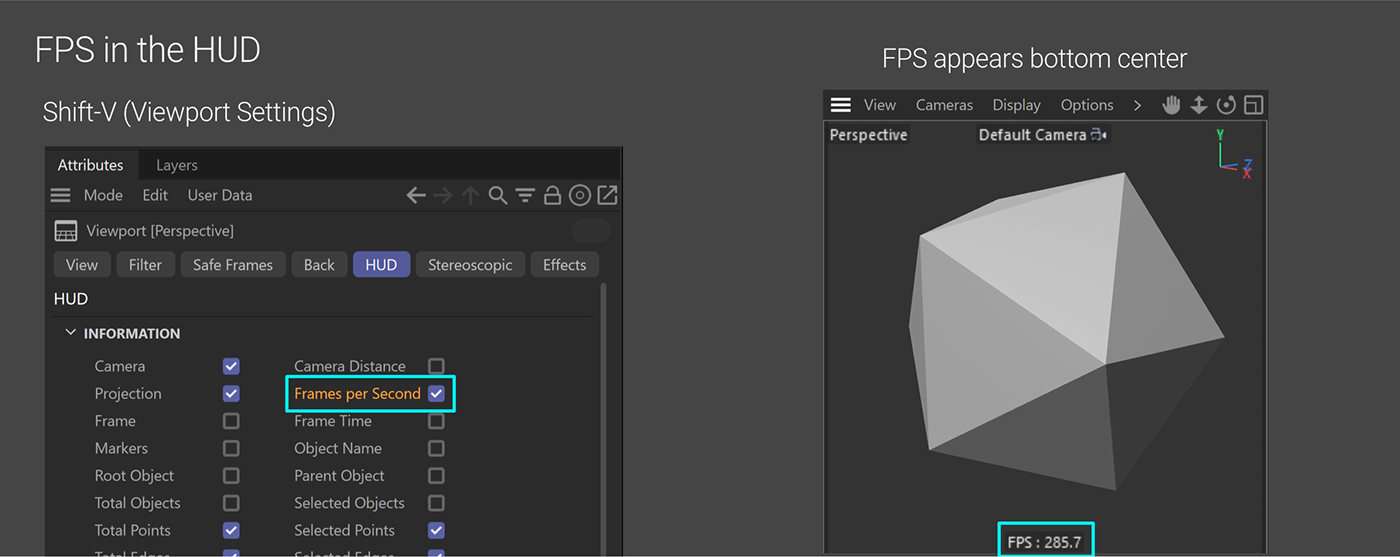
FPS is pretty easy - we can just hit Shift-V in the perspective viewport, go to the HUD tab, and turn on Frames per Second. Done and done.
Task Manager/Activity Monitor

Peak RAM usage can be found in the Task Manager (Ctl-Shift-Esc). To get it, we need to go to the Details view on the left side, and then right-click in one of the columns, choose “Select Columns”, and turn on the Peak working set (memory) column. Now, from the time we launch C4D until the time we close it, we can see what the highest amount of RAM used was. Great for these types of tests.
The Task Manager can also show us if there are any other memory-hogging apps open that we can shut down to make our C4D experience more efficient.
We can also use it to look at VRAM, but Octane has better tools for this.
VRAM

There are several places to check VRAM, but the most versatile is the Device Settings window. We can get to this by going to the Octane Settings (gear icon), choosing the Settings tab, and then clicking the Device Settings button. This will give us a breakdown of how the VRAM was used in our last render. Very handy.
Important: This assumes a render could be completed. If it hangs, or can’t render because we overloaded it, we’ll have to use other tools to do some diagnostics. We’ll go into that more in the other guides in this series.
Pre-processing time
Nothing fancy here, just going to use a stopwatch app on our phone. There are places in Octane to get timings, but an external stopwatch is better from a holistic standpoint - we can factor in time added by C4D and/or other background processes.
The Gold Standard
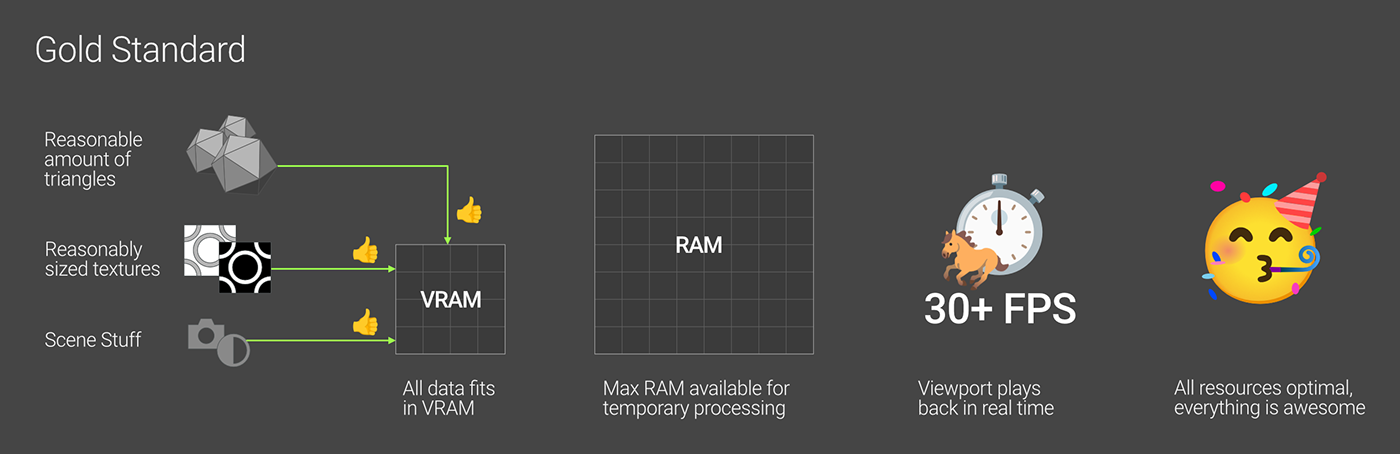
An Octane render is at its absolute best when all of the scene data (polygons, textures, instances, overhead, and everything else) fits completely in VRAM, and the system RAM does not fill up to 100% while processing.
C4D’s performance is at its absolute best when the frames per second reported in the viewport does not drop below the target FPS of the scene (this is covered more later in this guide.)
V. Establishing a Baseline
Let’s put all this to use and do a quick test to establish a baseline! We’ll want the Task Manager open in Details mode with the Peak Working Set (memory) column up, and the FPS HUD element on in our perspective viewport.
Now lets restart the computer, and shut down any unnecessary apps and processes. If we get the Task Manager back up again and look in the Performance tab, under Memory, we can see the system is using about 4 GB of RAM with nothing else open, so let’s make a note of that. Time to launch C4D and make sure our scene is completely empty. No lights, no objects... nothing.

Let’s navigate around in the viewport and keep an eye on the FPS number. This fluctuates like mad, but never really goes below 60 FPS, so we can just call that value >60. We’ll see why 60 is important in the next section. If we hit play on playhead, we can also watch the FPS counter and see that it’s well over 300. Probably 450-500, but this changes too. If it’s consistently over 30, we can safely time animations to it, so >300 means it’s great.
Octane isn’t aware of anything we’re doing yet since we never sent anything to render. We can get open the Task Manager and see that C4D is using 1.25 GB of VRAM though, so we’ll just record that. While we’re there, let’s take a look at the peak RAM - it’s right around 3 GB.
Everything is running perfectly, so this gets a party hat emoji for the highly technical “Experience” metric.
Let’s get our trusty stopwatch app up, and start it just as we render to the Live Viewer!
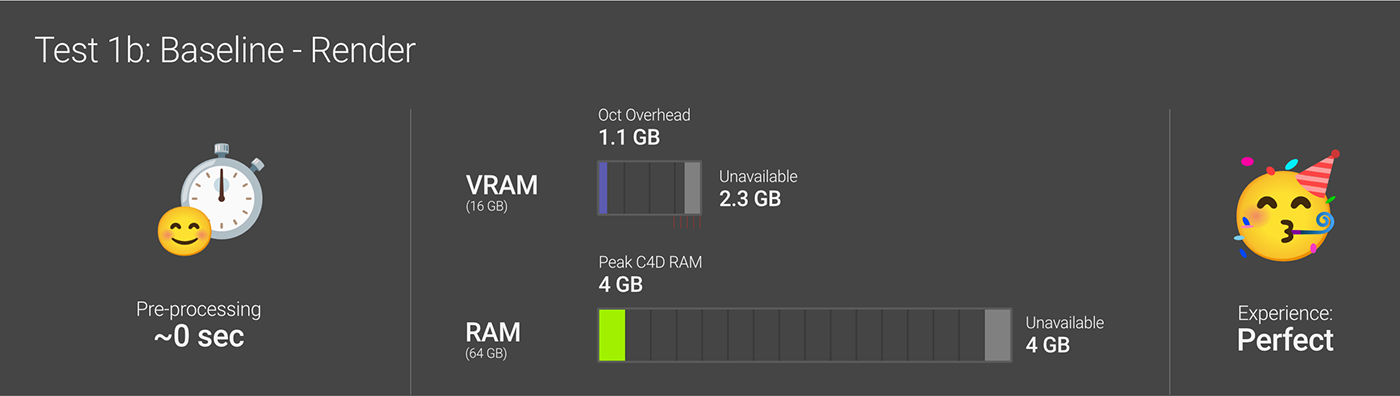
Looks like it rendered before we even had a chance to hit the stop button, so we’re going to say it’s instant.
Now if we pop open the Device Settings window, we’ll see that Octane used 1.1 GB in “Engine Runtime Data”. We’ll just call this Overhead. It’s also saying that there’s 2.3 GB in “Unavailable” VRAM. This is VRAM that C4D is using, as well as any other system overhead, so it’s unavailable to Octane.
The Peak RAM went to 4 GB during this process, leaving a ton of extra RAM available. This tells us that nothing is holding us back from creating a pretty complex scene on our system. Awesome!
VI. Further Information
At this point, we know enough to get our hands dirty, but there are a few other things that we may want to understand a little more.
Out-of-core Memory
The gold standard is for everything to fit into VRAM, but what if it simply can’t?
Octane allows us to designate a chunk of our RAM to be used in place of VRAM. This is known as Out-of-core memory (OOC), and it can be set in Octane’s settings (gear icon). While this does allow us to render larger scenes than we have VRAM for, we take a significant speed hit when doing it this way. Why?
1. RAM is much slower than VRAM, and it also doesn’t have a direct line to the GPU like VRAM does.
2. Any chunk of RAM that is being designated for OOC is a chunk of RAM C4D and Octane can’t use to pre-process the scene, so it has less room to breathe, and - you guessed it - means slowdown.
3. RTX can’t be enabled when using OOC, so ouch.
Any single object (geometry, texture, etc) must fit entirely into VRAM, or entirely into Out-of-core memory (OOC RAM). If it’s too large to fit in VRAM, it gets put into OOC. If it’s too large to fit in both VRAM and OOC, the scene will not render.
The whole scene can be split across VRAM and OOC, so some of the textures or geometry objects can go in VRAM and some can go in OOC.
FPS Deep Dive
FPS (Frames per second) is kind of confusing. At a very high level, it’s just referring to how smooth the viewport and animation playback are, but there are three different numbers that add up to this quality.
Render Settings FPS (user-defined): This refers to the number of frames per second that an animation is supposed to run at when it’s played back in a desktop player, on the web, or wherever else the rendered animation is used. In the US, C4D defaults to 30, but other common rates are 24, 25, and 60 for various regions/uses. It’s baked into the animation file and tells the player what to play back at.
Annoyingly there’s also a project setting FPS (Control/Command-D) that needs to be set to the same as the Render Settings FPS, otherwise C4D will render an incorrect total number of frames when the animation is sent to the picture viewer.
Screen Refresh Rate (hardware-defined): Technically this is measured in Hertz (hz) instead of FPS, but it’s basically the same thing for our purposes - it’s how often the display (monitor/screen) refreshes per second. This is a fixed hardware characteristic of a display panel - it can be reduced via drivers, but it can never be increased past the max without buying a new monitor.
The refresh rate effectively puts a cap on the FPS we can see. If an animation set to 120 FPS is played back on a 60hz screen (like the Razer we’re testing on), we’re going to see that animation at 60 FPS.
Viewport FPS (based on current CPU/GPU load): This is the number in the viewport HUD. It displays how many times a second C4D refreshes the viewport when something changes. If we pan or zoom around in the scene, or hit play on the playhead, you’ll see this number start to fluctuate. We started with about 300-350 FPS with our test hardware. Every calculation we ask C4D to do reduces this.
How to think about all these FPS numbers
Let’s say we set our render settings to 30 FPS - that will be the playback target on YouTube or wherever else we’re playing our final piece back.
Our screen on the Razer is 60 Hz. This means our ideal target for the FPS value in the viewport is between 30-60 FPS.
If we’re seeing 30+ FPS in the HUD (and our render settings are set to 30 FPS), that means we’re operating in realtime, and can properly time animations when hitting play on the playhead, and also have a fluid feel in the viewport while manipulating objects. Yay!
If we’re seeing above 60 FPS in the HUD, that’s also great, because it means we could technically ask C4D to do more (add more polygons, higher quality display, etc.) and still not notice any slowdown. We’re not going to visually notice a difference above 60, but that doesn’t mean it’s not nice having that extra headroom.
If we’re seeing below 30 FPS in the HUD, we’re starting to get into trouble. We can no longer reliably time animations during playback. If we don’t care about that, we can make do until we get into single-digit FPS. This is where things start feeling super choppy and laggy, and the experience of using the program starts to suck.
Once we get below 5 FPS, our lives become hell, and if we’re below 1 (meaning we start measuring seconds per frame), we need to seriously re-evaulate what we’re doing, because it’s pretty much unusable.
Wrap Up
This should be enough to establish a basic understanding of how the whole system works and start to give you some clues as to what to look for if things start getting unruly and slow. It should also prep you for the next set of guides in this series which will deep dive on some particular topics of interest.
Author Notes
OG028 Resource Management: Overview, version 1.0, Last modified January 2023.
This guide originally appeared on https://be.net/scottbenson and https://help.otoy.com/hc/en-us/articles/212549326-OctaneRender-for-CINEMA-4D-Cheatsheet
All rights reserved.
The written guide may be distributed freely and can be used for personal or professional training, but not modified or sold. The assets distributed within this guide are either generated specifically for this guide and released as cc0, or sourced from cc0 sites, so they may be used for any reason, personal or commercial. The emoji font used here is Noto Color Emoji.


