

PLNT System
One day, the "Big Tire Plant" decided to develop a production analytics and IIoT system to analyze the production processes of the enterprise. But ready-made solutions "out of the box" could not offer the necessary functionality. Therefore, the company asked Singula team to develop a unique production data analysis system that would allow them to analyze and visualize data, as well as identify bottlenecks.
The client is one of the world's largest manufacturers of premium car tires. The company owns 24 factories in 13 countries of the world, so this is a big and significant work not only for our team.

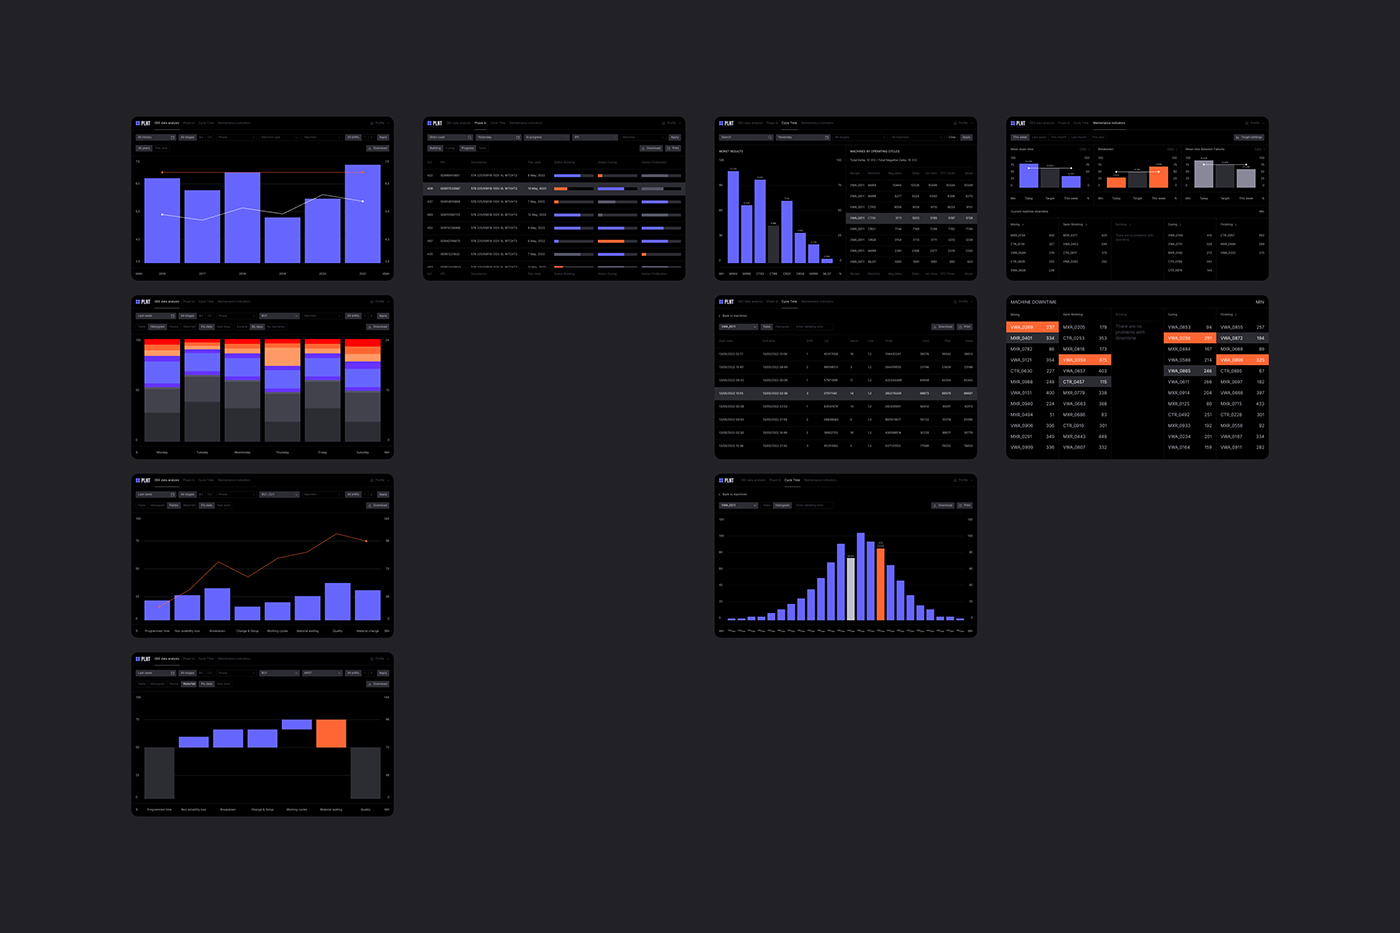
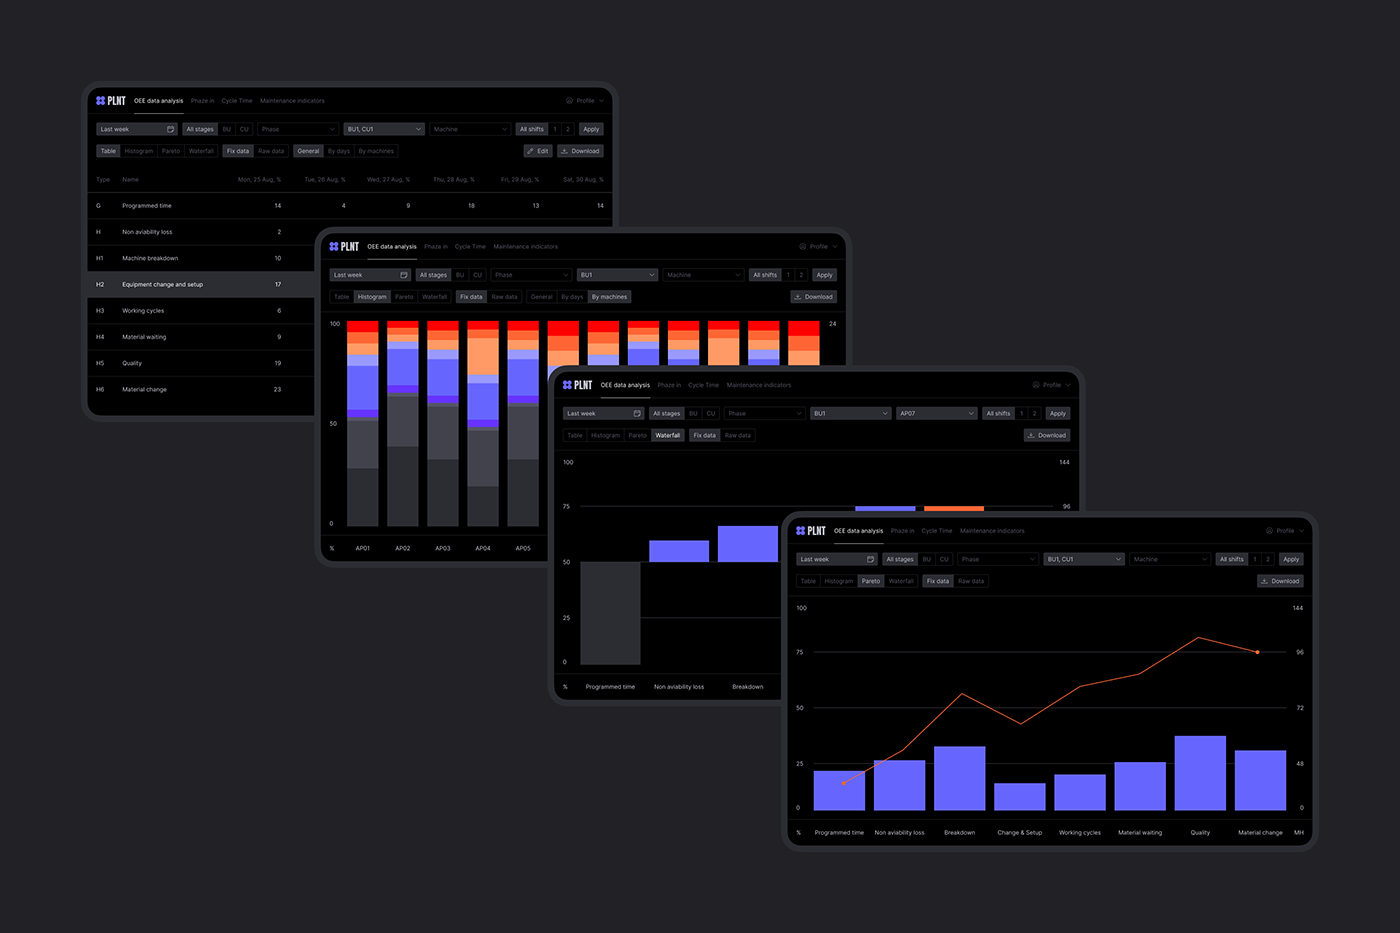
OEE Data Analysis
The plant has hundreds of machines that perform millions of operations every day. All the raw data on them is sent to one large common system.
With the help of the OEE section, various specialists can prepare the necessary reports on the analysis of equipment efficiency: planning, quality assessment, etc. As a result, top management collects several different reports, and based on their data, receives a general picture of production. At the same time, there can be thousands of such reports: for a shift, a day, a month, etc.


Phase In
This section helps you keep abreast of problems at each stage of production. For example, you can look at the processes for a specific type of machine and find out if everything is going according to plan.
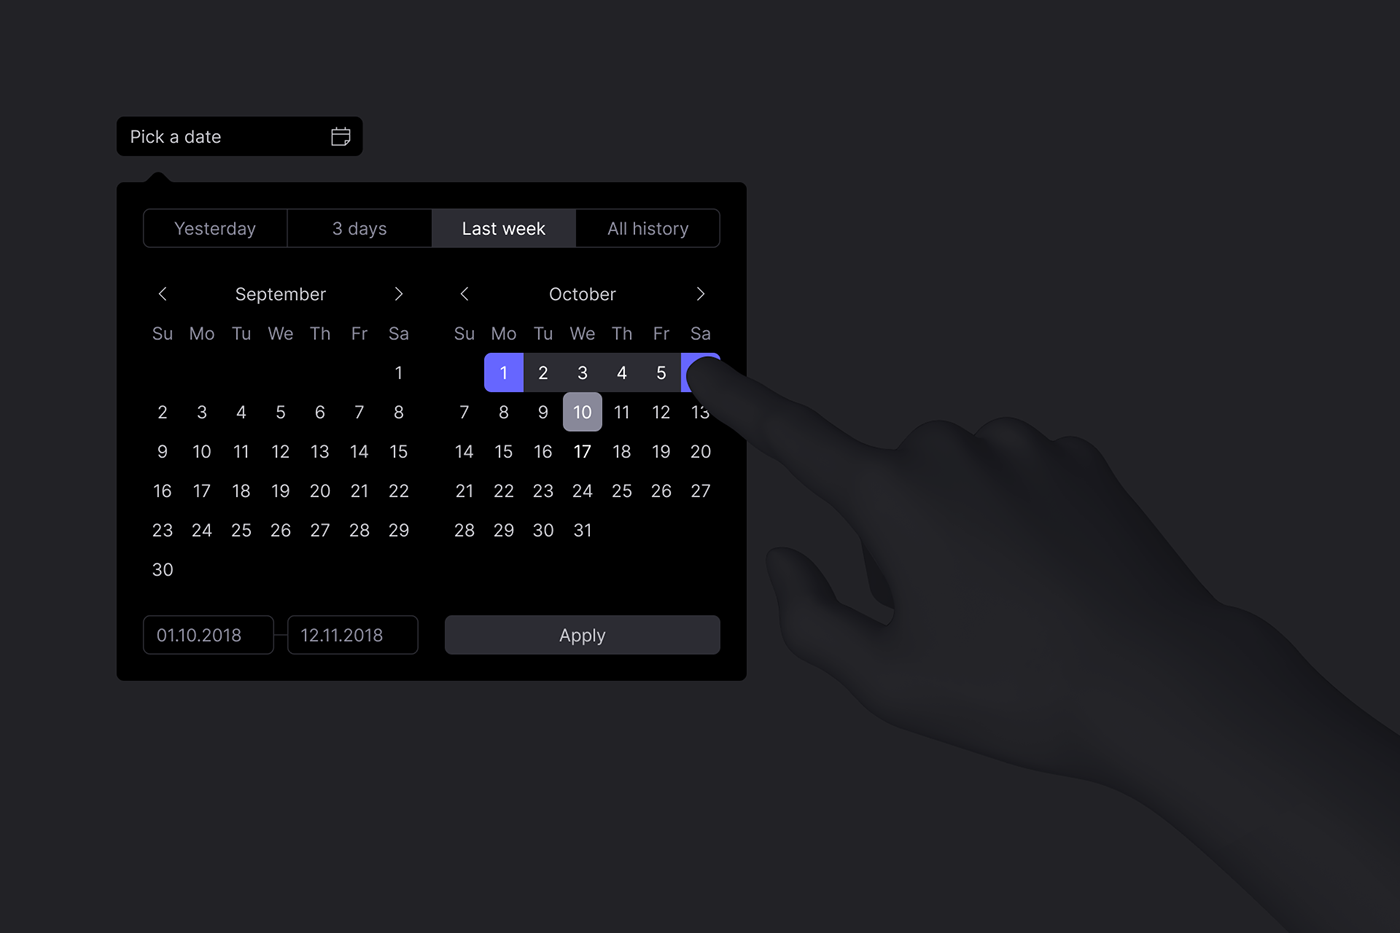
Each stage of production has checkpoints with a specific deadline. In the system, you can see the details on whether the process is behind or is going according to the planned schedule. Color coding helps you to understand the situation at one glance.


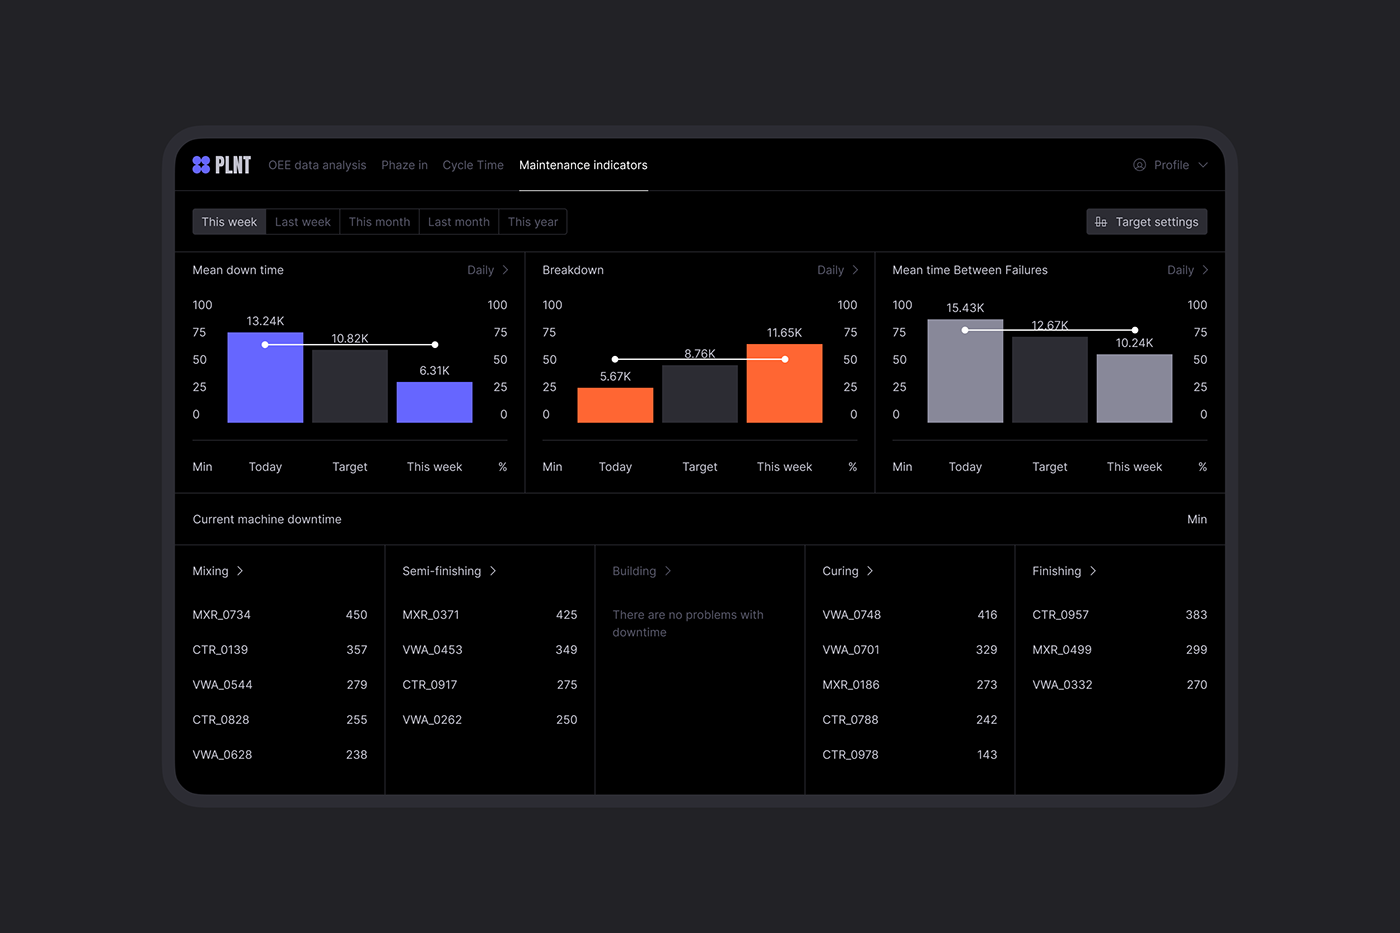
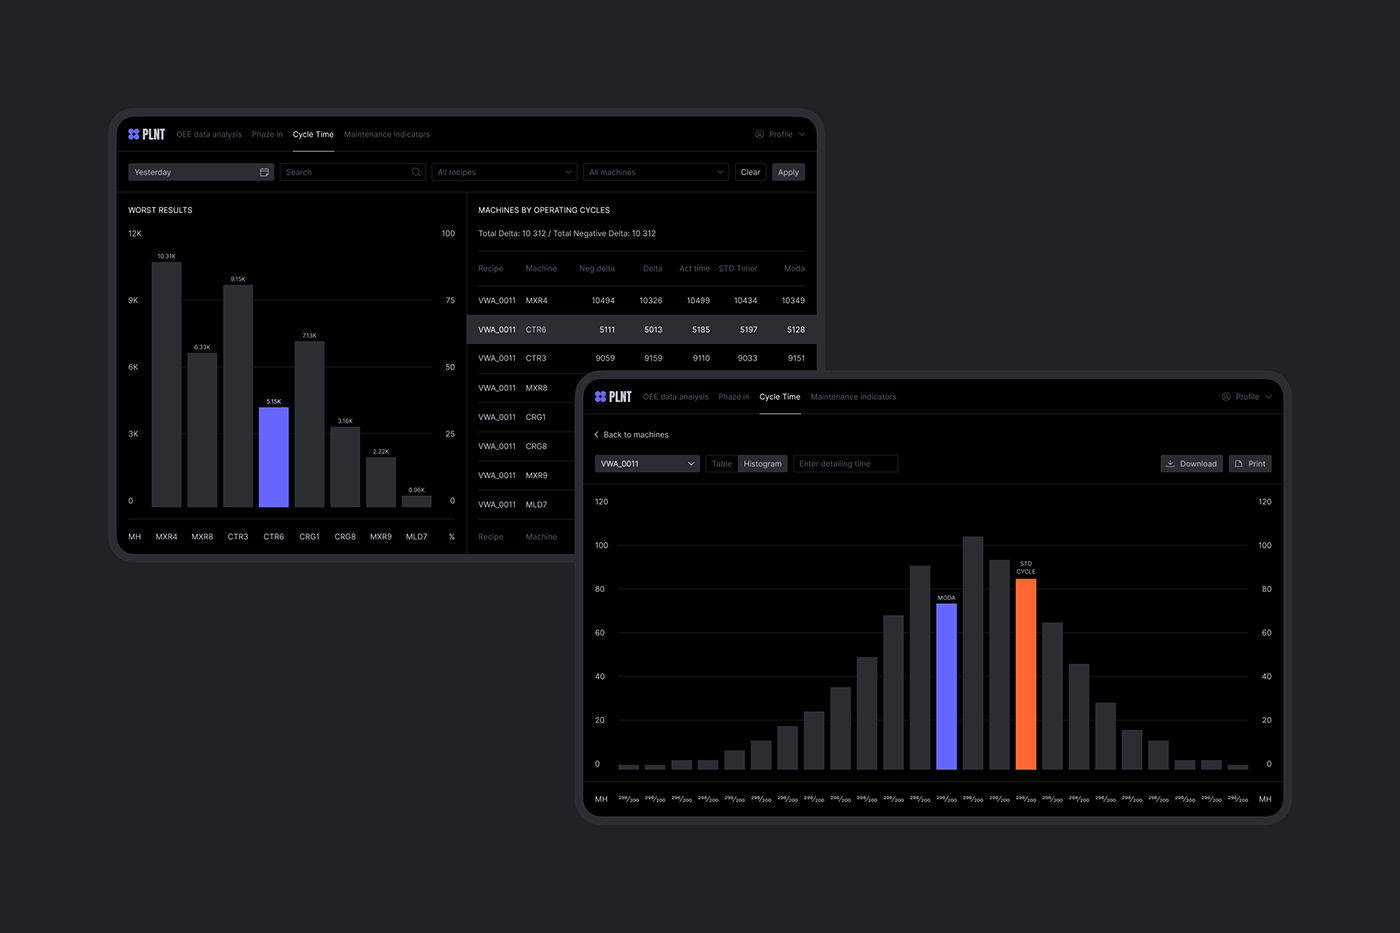
Cycle Time & Maintenance indicators
The Cycle Time section helps you see exactly which machines are working with which recipes and how well it works according to the production plan.
The Maintenance indicators section helps you navigate the operational nuances of maintenance. Here, you can see how often and for what reasons machines are idle. Data is analyzed to determine downtime details: which machines fail most often, which breakdowns are the most common, and which machines have been idle for a critically long time.This section is displayed on large screens in production areas as an identifier for operational problems. Operators see statistics in the process of work and adjust their actions depending on new inputs.
The Maintenance indicators section helps you navigate the operational nuances of maintenance. Here, you can see how often and for what reasons machines are idle. Data is analyzed to determine downtime details: which machines fail most often, which breakdowns are the most common, and which machines have been idle for a critically long time.This section is displayed on large screens in production areas as an identifier for operational problems. Operators see statistics in the process of work and adjust their actions depending on new inputs.
This is the Internet of Things in action.