Problem Statement:
When looking at a large enterprise security network there are many boxes interconnected, many IP addresses and host names to keep track of, and many dependencies to be aware of in case one server fails. We realized that within this interface the user would be configuring, potentially, up to 100 servers and their interconnectivity.
Initial Customer Research:
I had the opportunity to do some contextual interviews of some of our internal network administrators and of our customers' network administrators. After observing their workspace and the documents they create to keep track of their servers, two artifacts consistently stood out, the spreadsheet of servers and all information related to them and network diagrams.
Design Solution:
I decided to mimic these in my design to allow for admins to configure and work in one of two ways that seemed most common. Due to technical limitations the configuration portion had to be in the table format and the visual map would be for validating their configuration was correct.
Low Fildelity Storyboard:

The interaction for this feature was extremely complex due to the many dependencies between servers, the validation that needed to take place, and simply the amount of data that needed to be displayed at one time.
I tried to reduce the amount of data displayed to sizable chunks throughout the UI by grouping the servers via their hardware containers (chassis) and allowing groups to be expand/collapse.
I used color coding and highlighting to aid visual scanning of changes made before saving and after saving. This also helped the user find errors much more rapidly.
Zoomed in on the table-format used for configuration:

Because I observed many network admins using spreadsheets to manage and track their configuration, I designed a table-style configuration. Initially, I wanted to allow for inline editing in addition to allowing for bulk configuration via popups, but due to technical limitations and resources we needed to remove inline editing.
Zoomed in on the Server Connection Map:
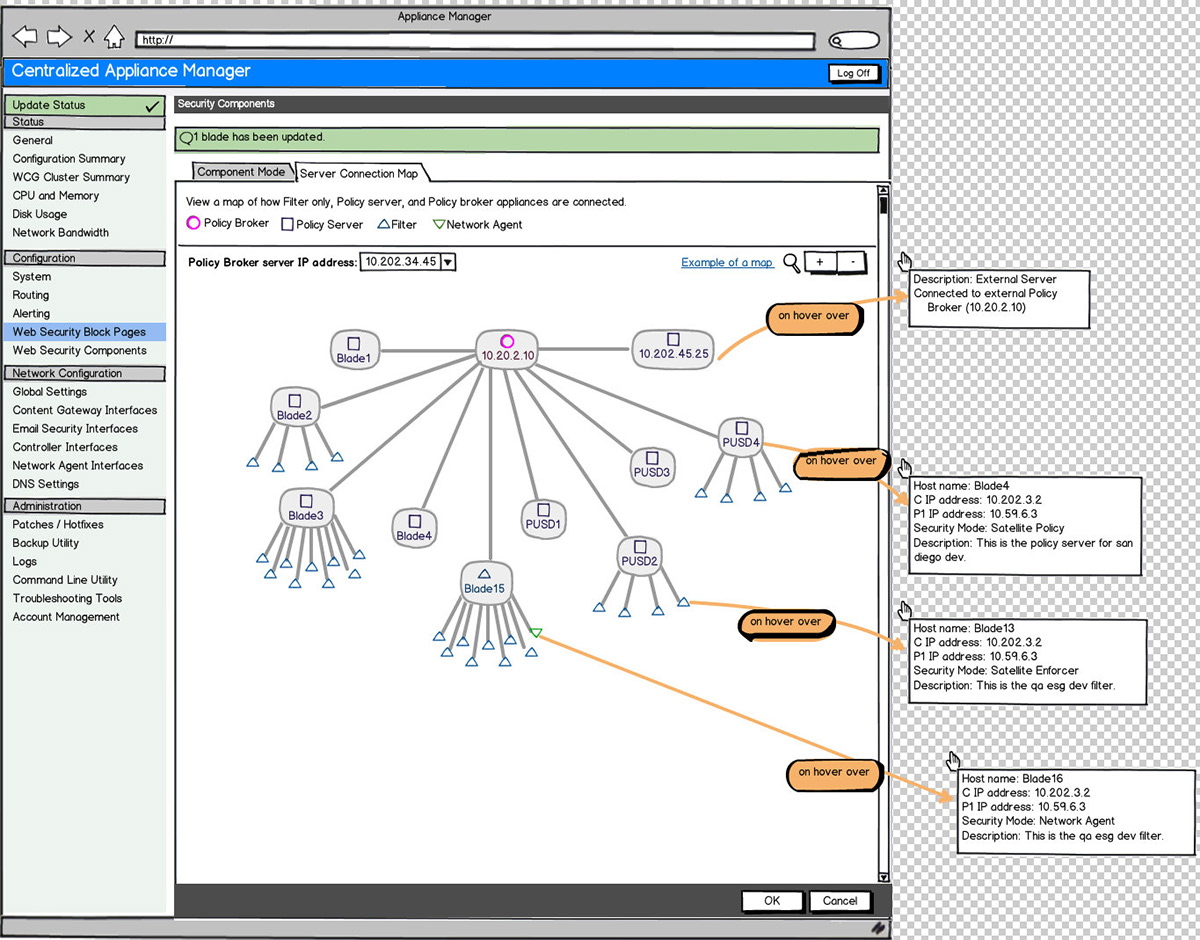
This is a mockup of the visual representation of the organization's security network. My initial design suggested that we allow for configuration via drag and drop of servers and allowing for inline IP address configuration, etc, but that was beyond the scope of the feature. Due to these limitations, I reduced the design to being a visual representation of the configuration done on the other tab.
One challenge we ran into was sizing. The map was intended to support up to 100 servers, which could very rapidly become too large. I considered expand collapse of different nodes, but didn't want the users to have to click through so much. We settled on allowing for zooming in and panning across the map. Additionally using icons to represent the different types of servers in the hierarchy and only displaying server name for the higher level servers. On hoverover of each server the user would be presented with all of the essential information about that machine.
High Fidelity Prototype - Table Configuration:

Because this was a new component, new interaction paradigm, and a lot of complexity, I created an Axure prototype. The primary purpose was to demonstrate the interaction and let the developers play with it. I provided the team with a step by step walk through to make sure they had the opportunity to see all popups, screens, etc.
High Fidelity Prototype - Visual Map:

This the high fidelity prototype for the visual representation of the previous configuration. Note: At this stage all new graphics had yet to be designed and thus I used a simple gray or a placeholder.
Final Build:
Unfortunatey this project was cancelled before we were able to see a final product, but the team worked very collaboratively to make code adjustments for my design and as mentioned above I reduced the scope of the design to aid the team in building within their resources.
