- 2013 -
CLIENT N/A
ROLE Research, Information Design
ROLE Research, Information Design
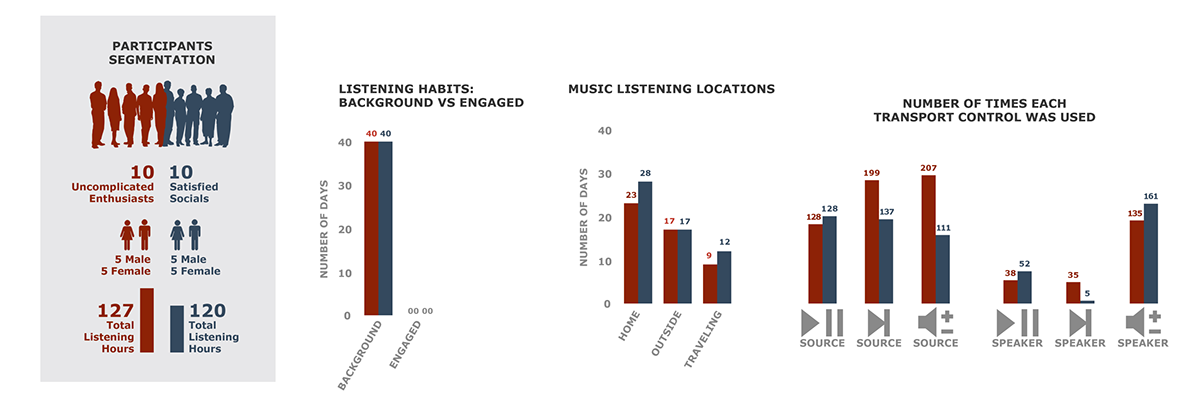
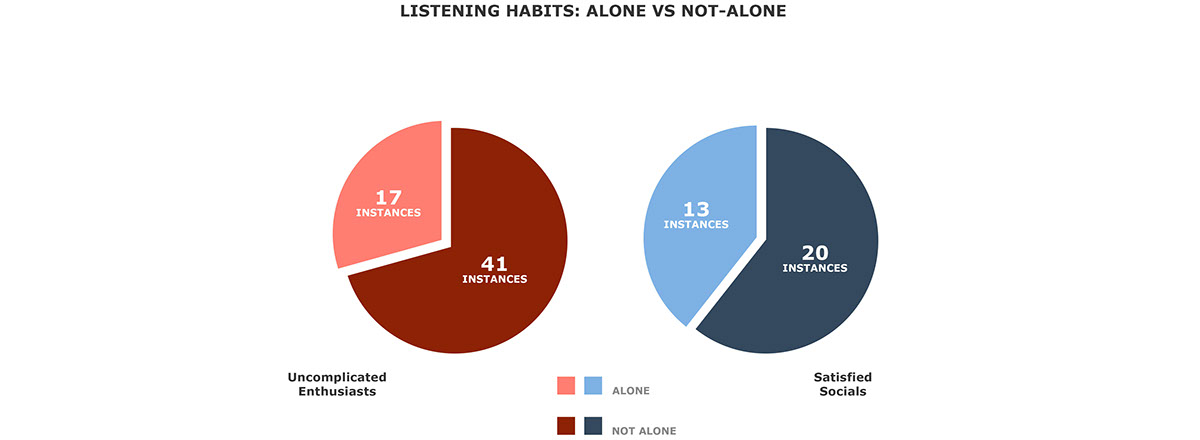
Raw data is not very pleasant to look at, nor is it easy to understand during team meetings when you need to make quick decisions. In order to solve that problem, I helped organize the raw data by creating easy to understand infographics. The user study, conducted by our UX team, was created to study music listening behavior between two different types of customer segments. The final presentation helped us positively influence the product innovation team in making user-centric decisions.

Music Diary
Group of 30 participants were asked to keep a diary for four days, in which they had to note, and keep track of several behaviors regarding playing and listening to music.


OTHER PROJECTS
• Competitor analysis
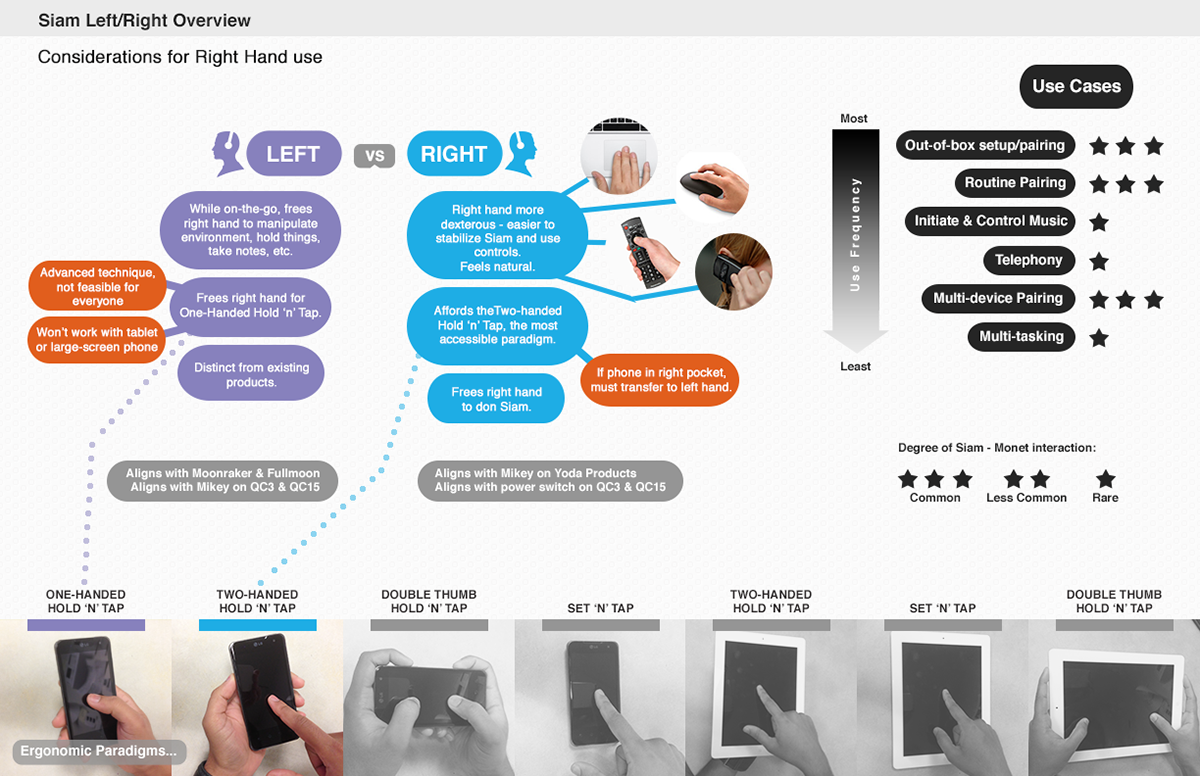
• Headphone music playback controls: left vs right side
• Global search feature for SoundTouch
• Headphone music playback controls: left vs right side
• Global search feature for SoundTouch