This project was created to visualize the audience research of the most popular
russian-language website about business — vc.ru.
Another goal of this project was to attract advertisers to the project.


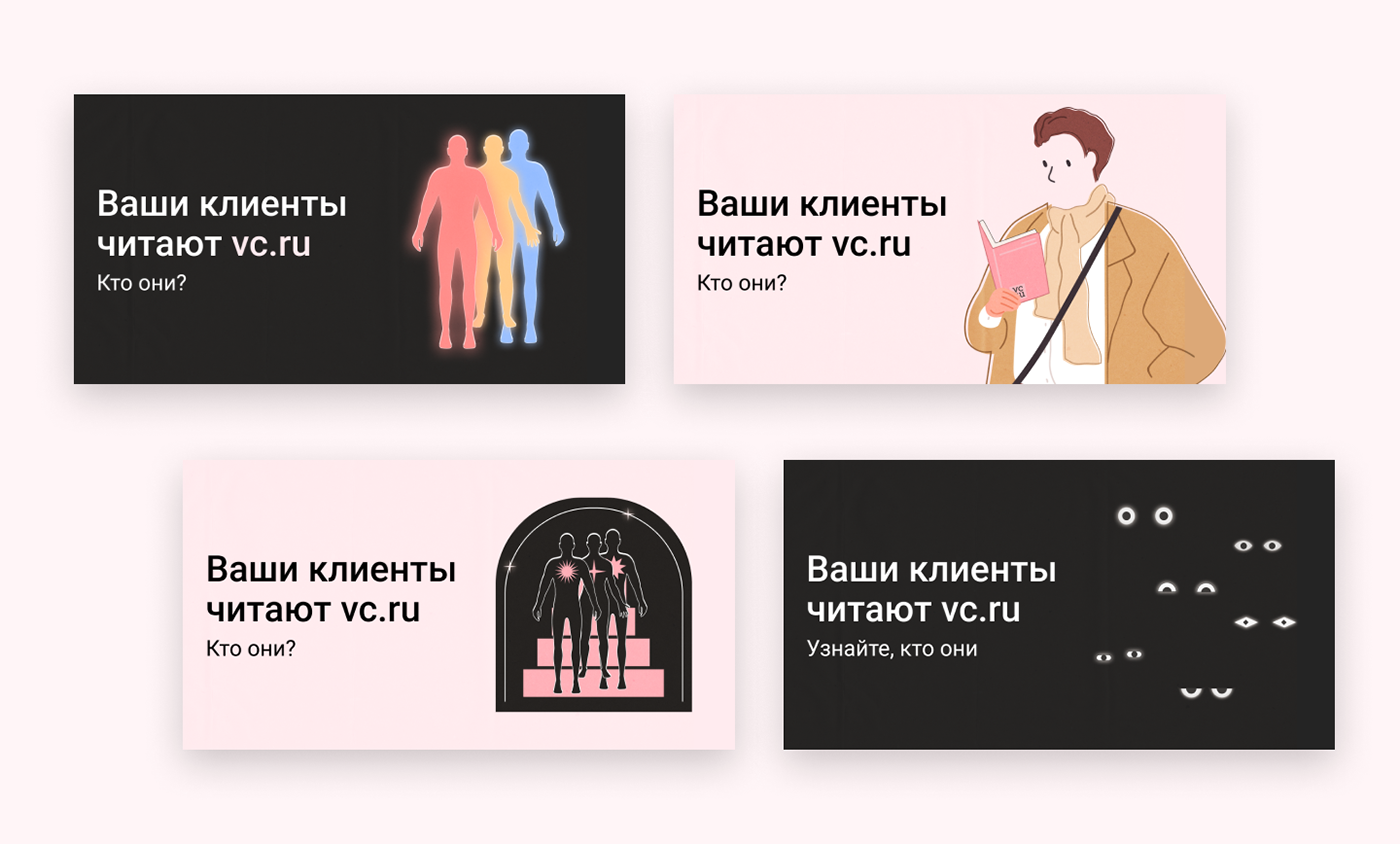
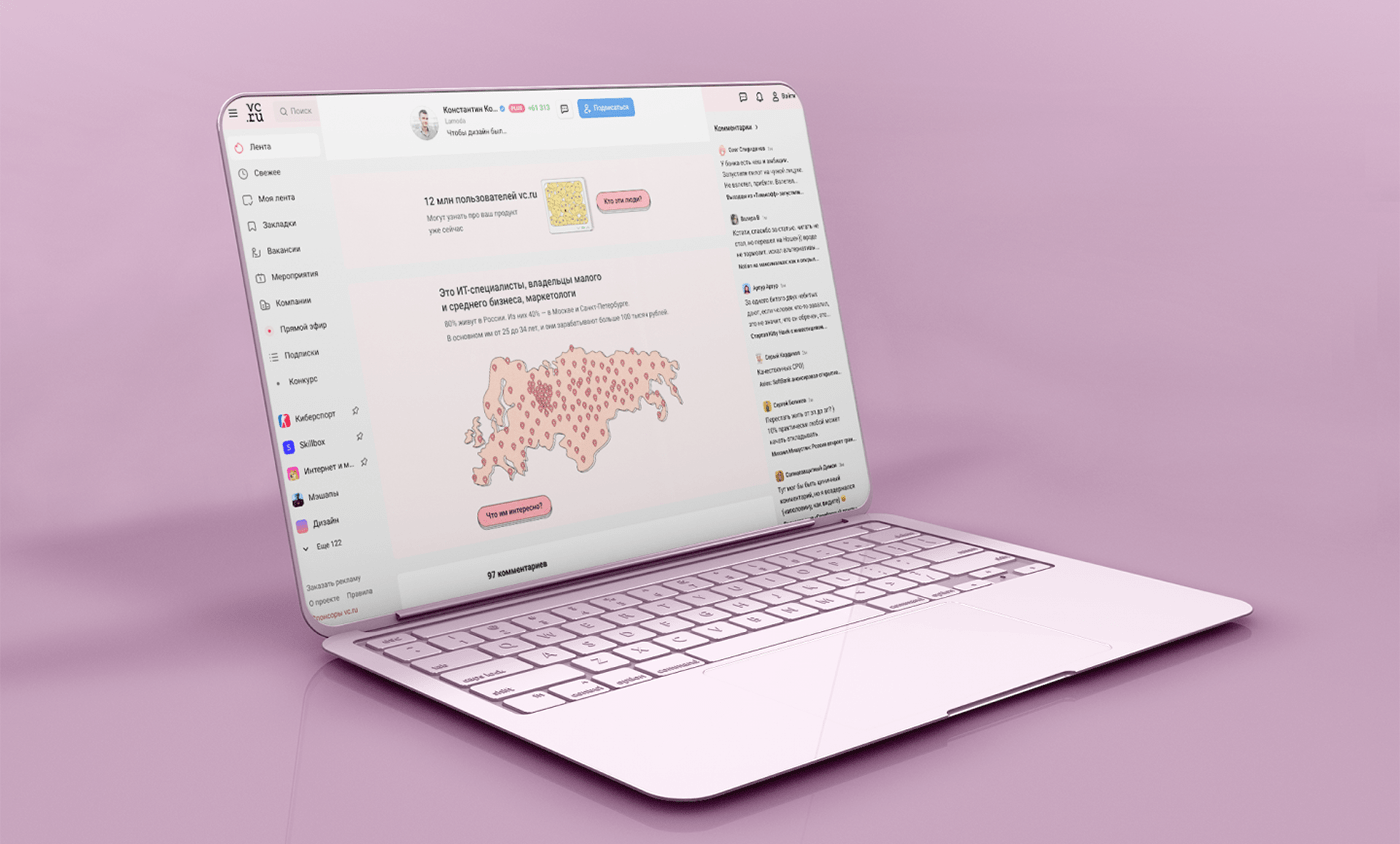
On the first screen, it was necessary to depict how many users visit the website(12 million) and how different they are. The main idea is that all these users can see your product.


I decided to choose this option because it contains the elements of the site interface (upvote and downvote buttons), and the user immediately understands that this
is an internal project.

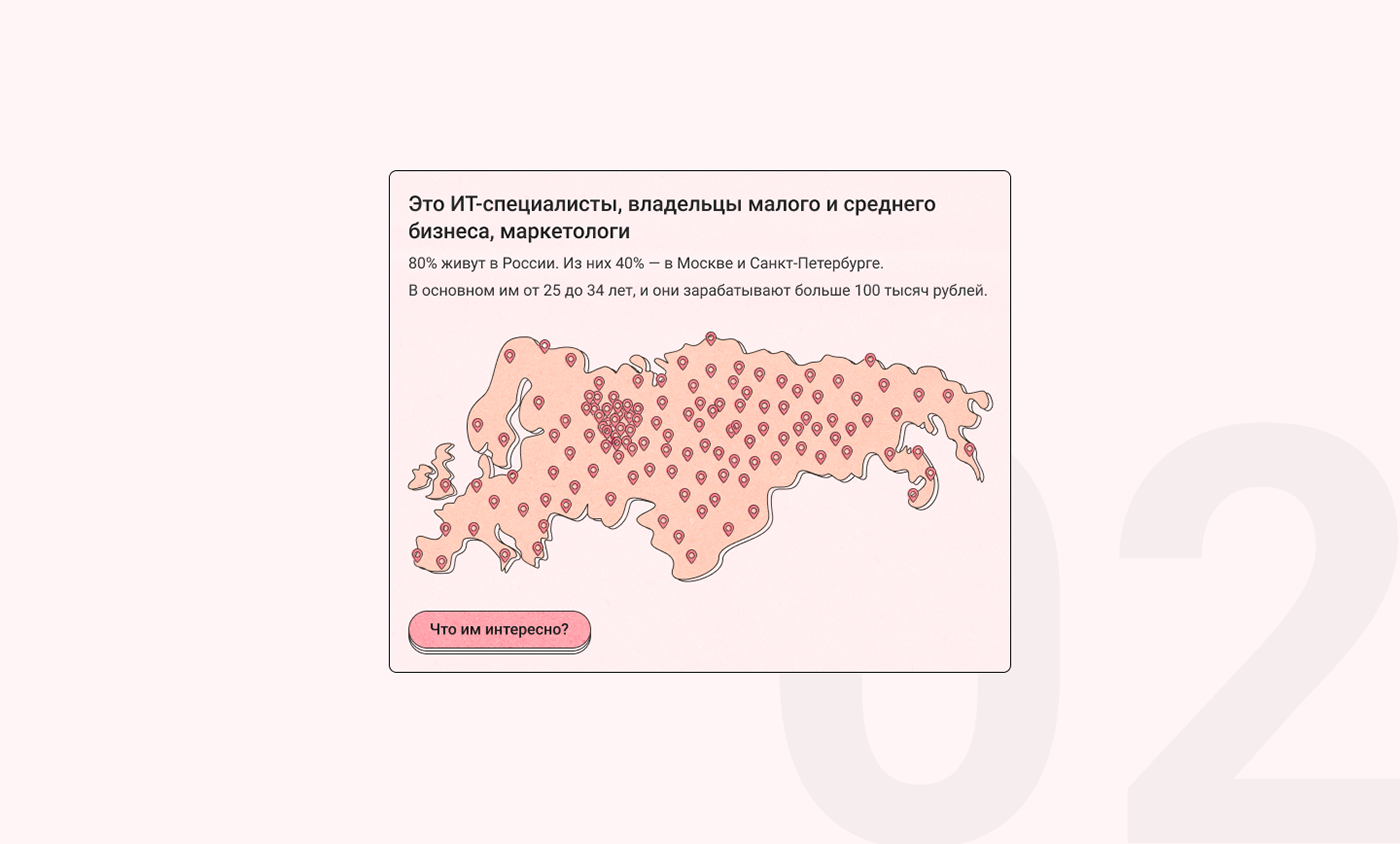
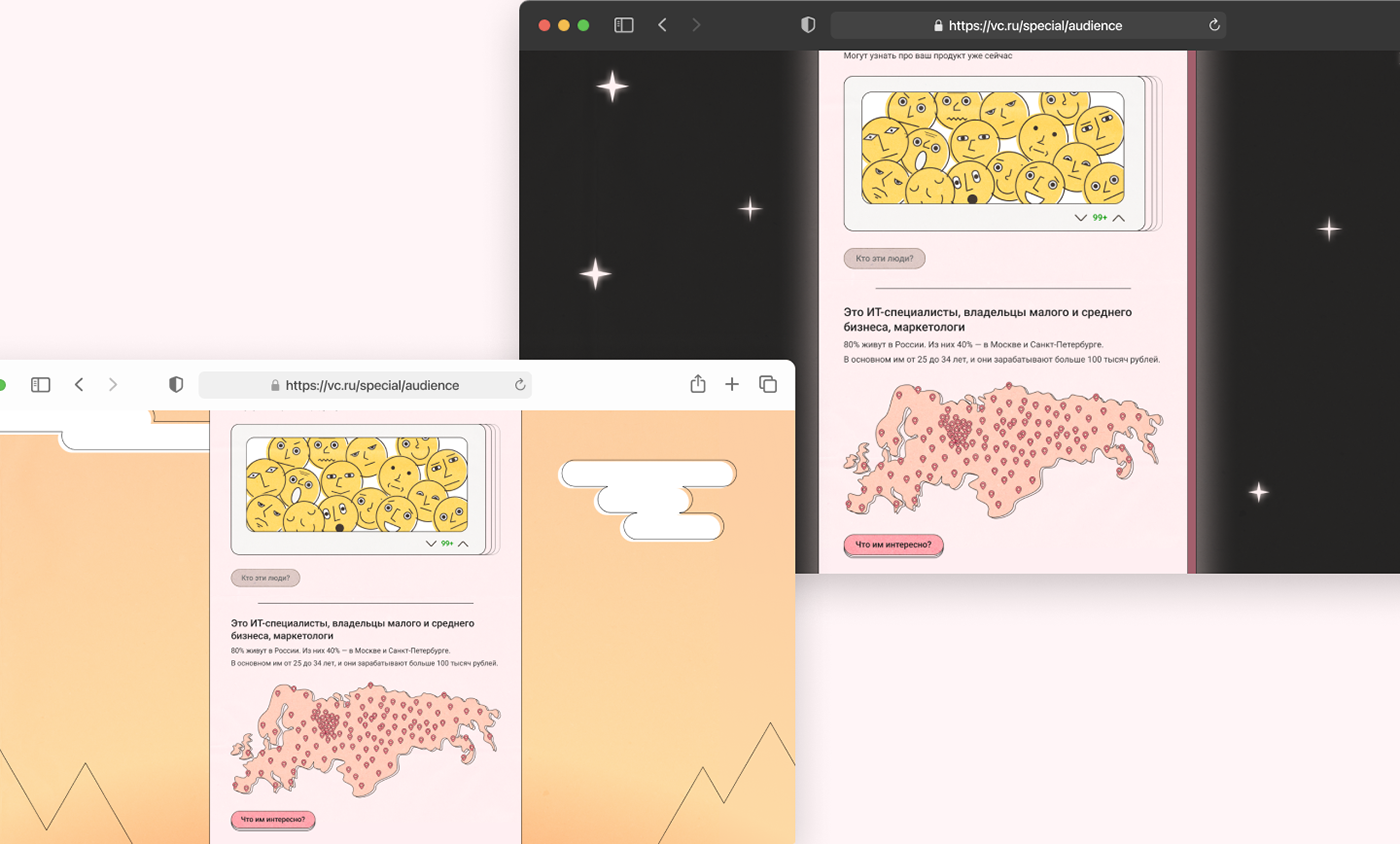
The second screen represents the percentage of users by geographical,
age and financial characteristics.


It seemed to me the most successful illustration is a map of Europe
to show the geographical ratio.
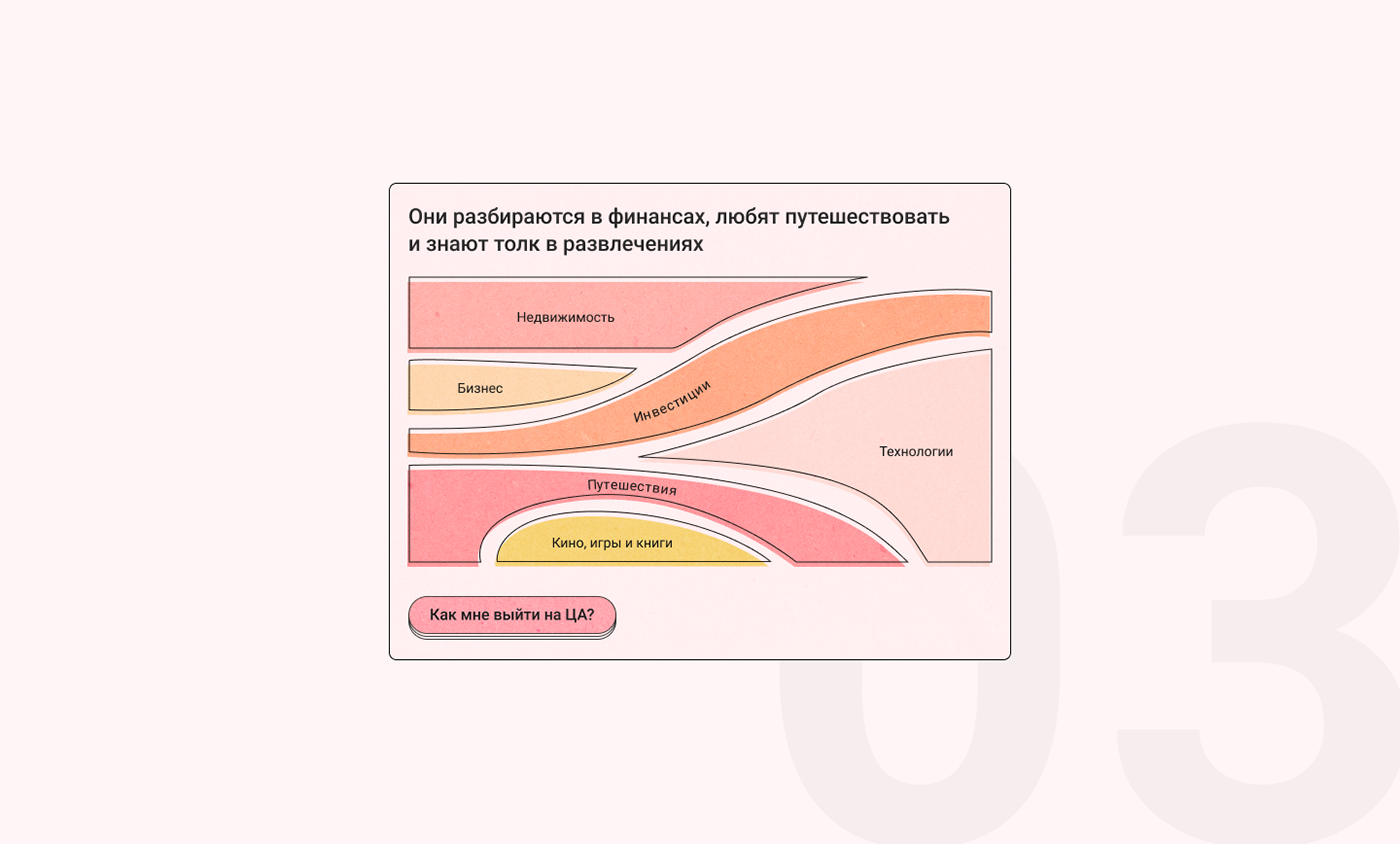
On the third screen, I had to show the hobbies of users, based on the popularity
of the sub-sites they visit.


Here I decided not to use the usual graphs and charts, but to show the percentage distribution in a more unusual way.
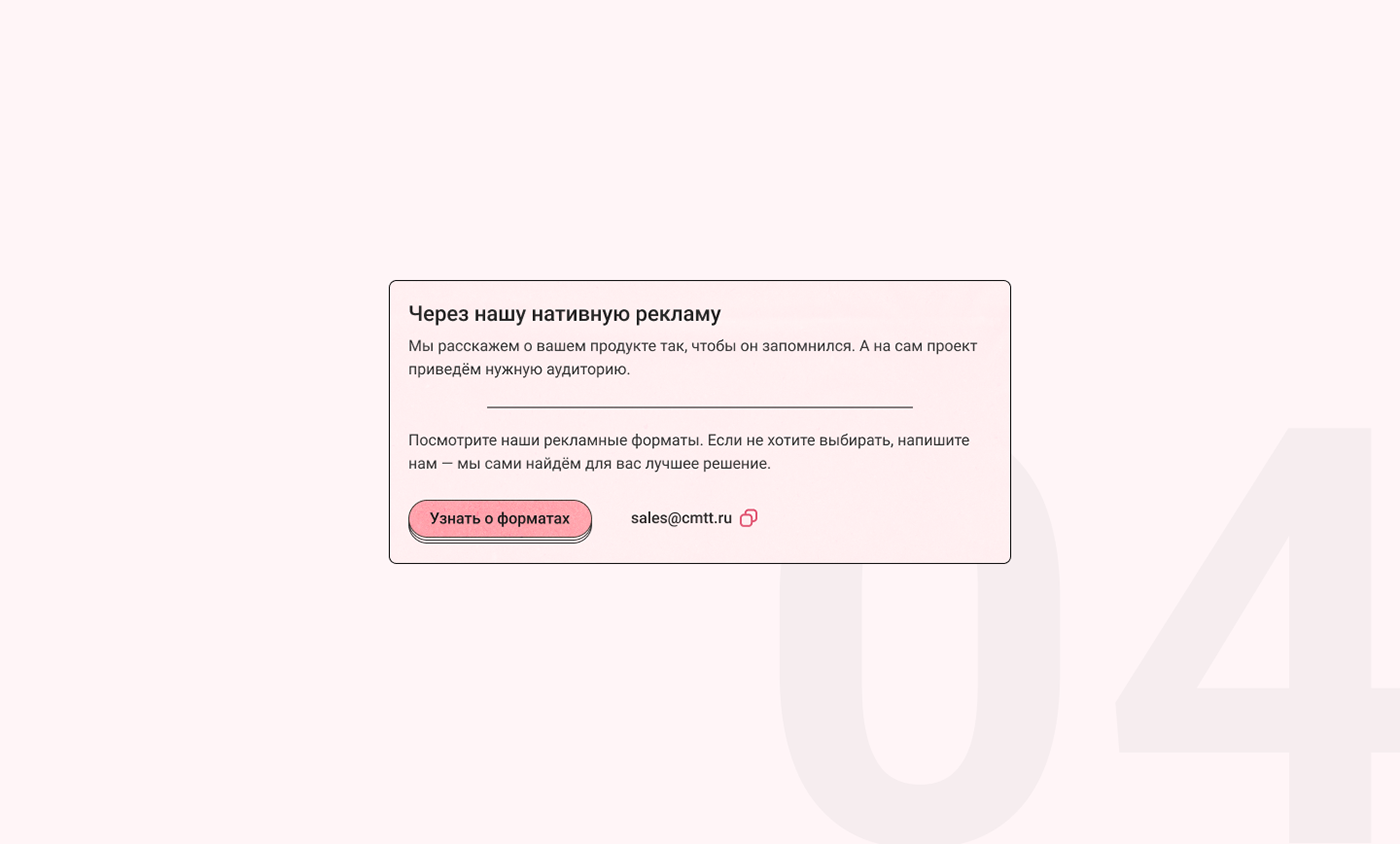
The final screen where the user can contact and order advertising.
On the website page:
Mobile adaptation:

Full-screen versions:
Media Snippets Variations: