Social Extremism: A Data Visualization
Overview:
Based on the randomized study found in the American Economic Review, “The Welfare Effects of Social Media” published in March of 2020, this study of over 2,700 individuals discusses how social media use is connected to political polarization, as well as subjective well being and activity levels of participants.
Our visualizations are targeted to a public interest technologist who will be using the data to help make recommendations to government policy makers or self regulating technology companies. We believe bringing technologists and policymakers together is a key to surviving the rapid advancement of technology. The user is a decision maker with a deep understanding of both the policy tools available to modern society and the technologies of AI, machine learning, and the algorithms that drive social media. Our goal is for our data visualizations to make it easy for the user to make connections and create a safer experience online for our communities as social media grows as an influence.


Data Description:
Our data consisted of 2 surveys taken at the start and end of the experiment, a list of ID’s of participants that completed the survey entirely, and a poll conducted through SMS messages which was taken daily over the course of the experiment.
The start survey assigned each participant to a unique ID number, collected their general information (race and gender), and had the participants answer an array of questions regarding their opinion towards the two political parties and the president, as well as gathering information regarding their lifestyle and leisure activities that they participate in outside of Facebook.
Participants were then asked to engage in a four week long detox from Facebook. During this time participants were greeted by a collection of text messages every day, were asked to describe their overall happiness and if they are experiencing feelings of loneliness on a scale from 0 to 10. Once the detoxification had been completed, the participants were once again asked how they felt towards the two main political parties and the then current President Trump. This time however, each participant was asked about the amount of time spent in their leisure activities and if it had been affected over the course of the experiment, and rate them as either: A lot less, A little less, Same, A little more, or A lot more.


Data Cleansing:
Using this information, we downloaded all the stata files and turned them into dataframes using pandas. From there we were able to isolate the participants that managed to complete the experiment by using only participants whose ID appeared in the ID qualified list. From there we collected the race and gender data from the survey taken at the start of the experiment, and merged each person's ID with the appropriate race and gender. We then noticed that the information in the baseline and endline survey was collected in wide form, in order to present the political opinions graph correctly we needed it converted into long form. Thus we filtered out any unnecessary information from our data frames and converted them into long form by melting them based on their ID. We used a similar technique when collecting mood data in our sms dataframe, and the leisure activity information. As a result this left us with a collection of data frames which contained the specific mood (Happy or Lonely) and the intensity of that feeling on each given day, the opinion that each person had of both political parties and Trump, and lastly the amount of time spent on leisure activities and how they changed over the course of the experiment. This provided us with all the information necessary to produce the visualizations.
This data and more information on the experiment can be found here: https://www.aeaweb.org/articles?id=10.1257/aer.20190658.

Visualization:
The scenario we created revolves around a public interest technologist wanting to know the kind of effect that Facebook has on people, as well as the effect of stopping its use on mood, activities, and political bias. To fulfill that task, we employed the use of line, bar, and box plot charts. The line chart was useful for showing change over time, as the participants responded over the course of the study and the drop in loneliness happened quickly, from one day to the next.
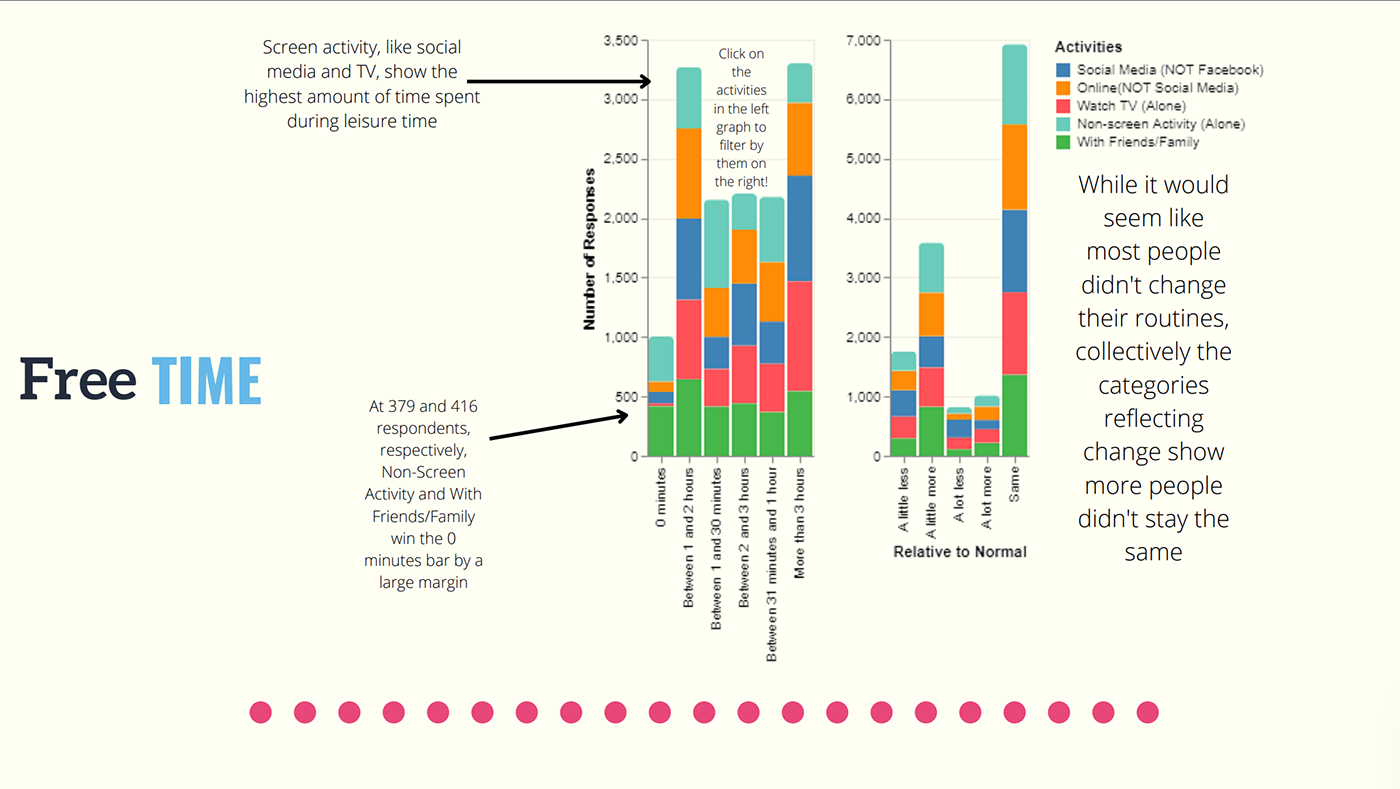
However, the data from the study over activities and political affiliation was only from the beginning and end of the study, not during. In order to effectively show the data of activities and compare the timeframes against each other, we used the timeframes as the x-axis of a bar chart. The before and after had different scales, so it would not have been effective to use a different kind of chart as it would not have shown the data in an easy to read manner.
The scenario we created revolves around a public interest technologist wanting to know the kind of effect that Facebook has on people, as well as the effect of stopping its use on mood, activities, and political bias. To fulfill that task, we employed the use of line, bar, and box plot charts. The line chart was useful for showing change over time, as the participants responded over the course of the study and the drop in loneliness happened quickly, from one day to the next.
However, the data from the study over activities and political affiliation was only from the beginning and end of the study, not during. In order to effectively show the data of activities and compare the timeframes against each other, we used the timeframes as the x-axis of a bar chart. The before and after had different scales, so it would not have been effective to use a different kind of chart as it would not have shown the data in an easy to read manner.
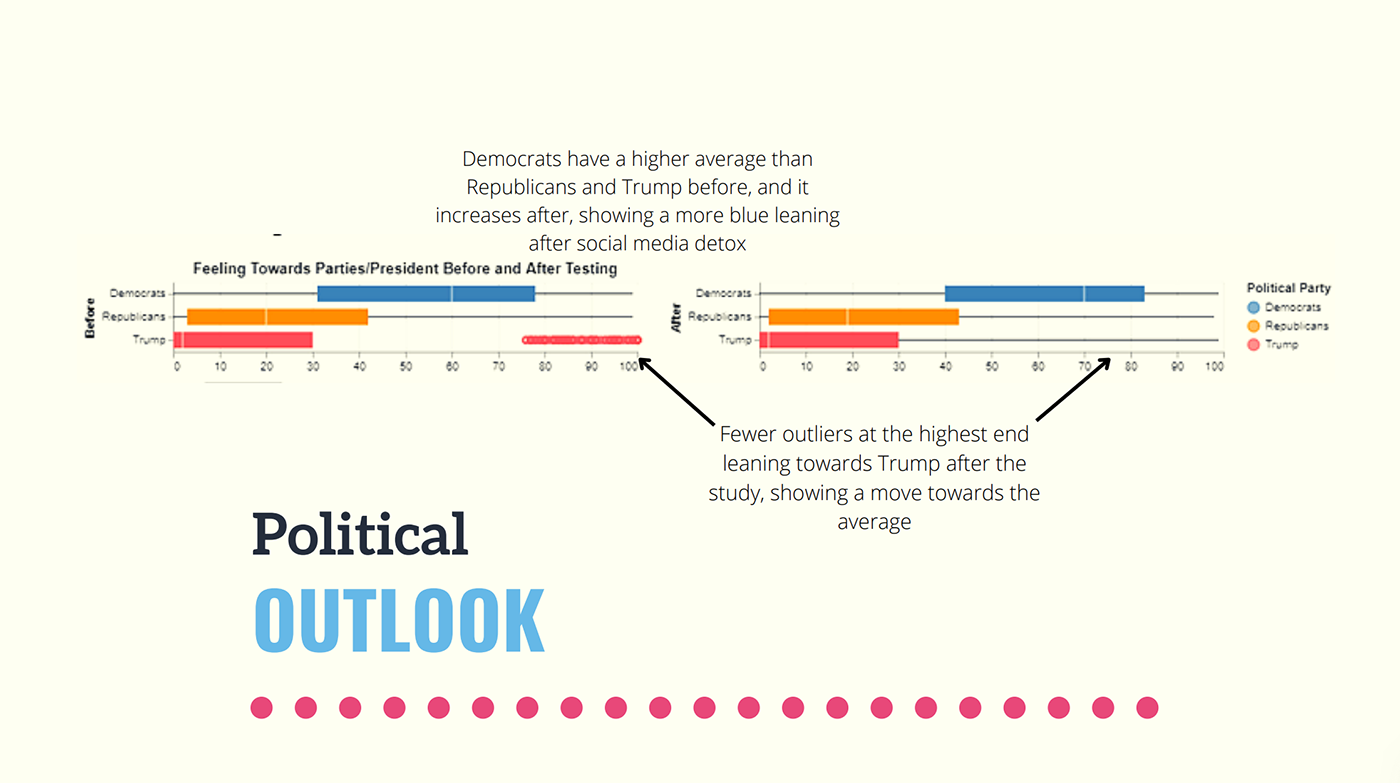
Finally, the political affiliations data was based on a 0-100 response. Since the response was such a large scale and it would be important to see the average versus the outliers, we decided to use a box plot to encode our data. It shows the average as well as the range of responses, with outliers very visibly coded so that we could see where the more controversial opinions would be sitting. For our dashboard, the main interaction is two dropdown menus that sit below the political opinion charts. They filter all of the charts based on the respondent’s race and gender. Since our user is an adviser for policymakers, the demographics of the study would be important to understand how best to go about forming policy and running for reelection.
For example, Caucasian men matched the loneliness trend of the study, but tended to spend more time online but not on social media than Caucasian women did. The bar charts have an additional layer of interactivity in that when you click on one of the activities in the left chart, it filters the data of the right chart to highlight that activity. It helps focus the user on figuring out how much the respondents changed their activities based on the detoxification portion of the study. Filtering by activity, the participants had larger trends of less screen time and more time away from screens. All of the charts have tooltips to allow the user to find out more information. For the line chart and the left bar chart, the tooltip shows the count of respondents, with the bar chart also dividing the count between each activity segment. For the right bar chart, it shows the count and activity. For the box plot charts, the tooltip shows the maximum, median, and minimum survey result of the selected political party.
For example, Caucasian men matched the loneliness trend of the study, but tended to spend more time online but not on social media than Caucasian women did. The bar charts have an additional layer of interactivity in that when you click on one of the activities in the left chart, it filters the data of the right chart to highlight that activity. It helps focus the user on figuring out how much the respondents changed their activities based on the detoxification portion of the study. Filtering by activity, the participants had larger trends of less screen time and more time away from screens. All of the charts have tooltips to allow the user to find out more information. For the line chart and the left bar chart, the tooltip shows the count of respondents, with the bar chart also dividing the count between each activity segment. For the right bar chart, it shows the count and activity. For the box plot charts, the tooltip shows the maximum, median, and minimum survey result of the selected political party.
Reflection:
The project has evolved as we grappled with the format the study used to survey their participants and the resulting available data. Our first idea was to look at the level of political polarization caused by social media and whether or not leaving sites like Facebook would decrease polarization. That is still present in our end product, but it’s not the main focus.
We found that the study also measured the mental wellness of thousands of users before, during and after a four week break from Facebook. As our data and goals changed, so did our visualizations. At first we wanted a bubble chart to show the level of polarization, but as our domain became more clear, the more we realized we couldn’t use that. Our technical goals changed as well because initially we were considering targeting users who were the social media users themselves.

Again, as our domain became clear about wanting to focus on mental well-being, we realized our users wouldn’t be individual people wanting to know how social media was affecting their political views; it would be public health officials wanting to understand the impact that technology and especially social media had on its citizens. Our original proposal did not work, as we also wanted to include the results of a weekly test that respondents took over current events during the study. However, the way the data was collected did not work with Python or Altair in a way that would make sense or be beneficial to our user task, so we decided not to pursue it.
We also had a lot of trouble with formatting and cleaning our data in a way that Pandas would accept and work with, delaying our ability to encode it into visualizations and add interactions to them. If we were to remake the project, we would want to try to fit in these test results so that we could include another visualization, as well as add interactions. For example, if you did an interval selection on the political affiliation graph it would show the mean mood responses of those people on the mood chart.

