WIKIFLOWS
One year on Wikipedia
Wikipedia, whether we like it or not, has become one of the major sources of information.
Whenever something happens, a particular book is quoted, a famous person dies (who we really don’t know anything about), we just google it, landing, in most of the cases, on a Wikipedia page.
Due to its popularity and to its policy that allows anyone to edit pages, Wikipedia often becomes a battlefield, where different factions try to impose their view on controversial topics (hopefully) trying to find a compromise.
All these activities generate a huge amount of data that the encyclopedia collects and makes available to everyone.
For the sake of its nature, it is possible to use Wikipedia as a device to look up the past: which were the most visited pages during 2013? Which were the most edited? What’s the overall picture of one year of history looked through Wikipedia?
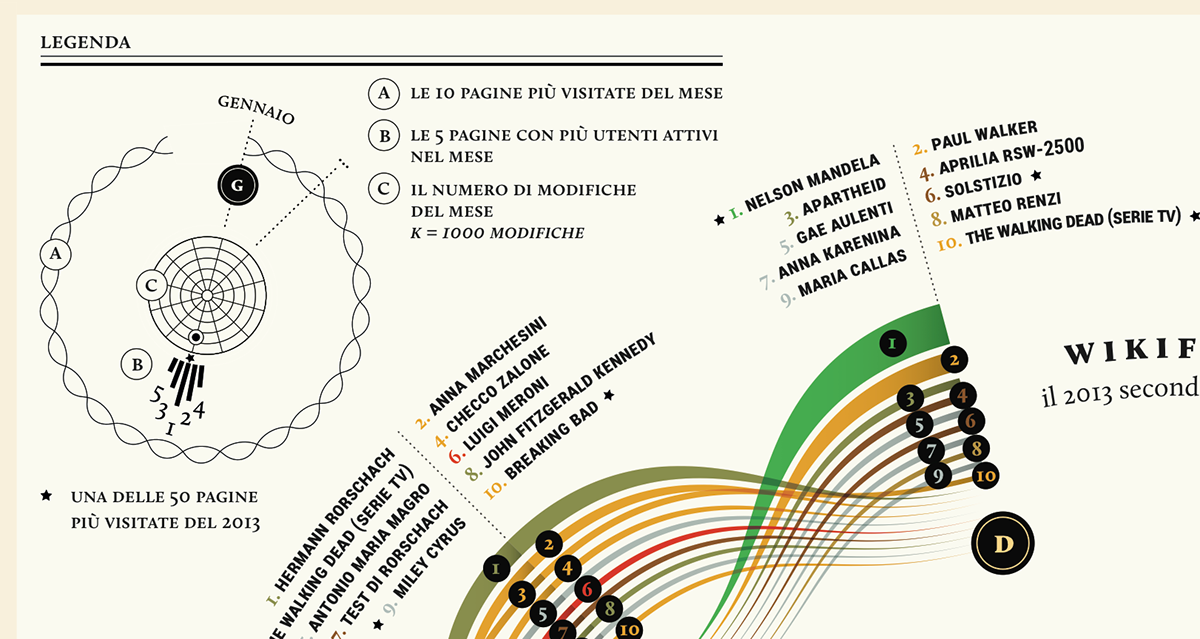
For this visualization, we collected all the data on page views and edits on it.wikipedia.org in 2013.
Months are radially distributed (the letters refer to the Italian initials of each month: G= January, D=December).
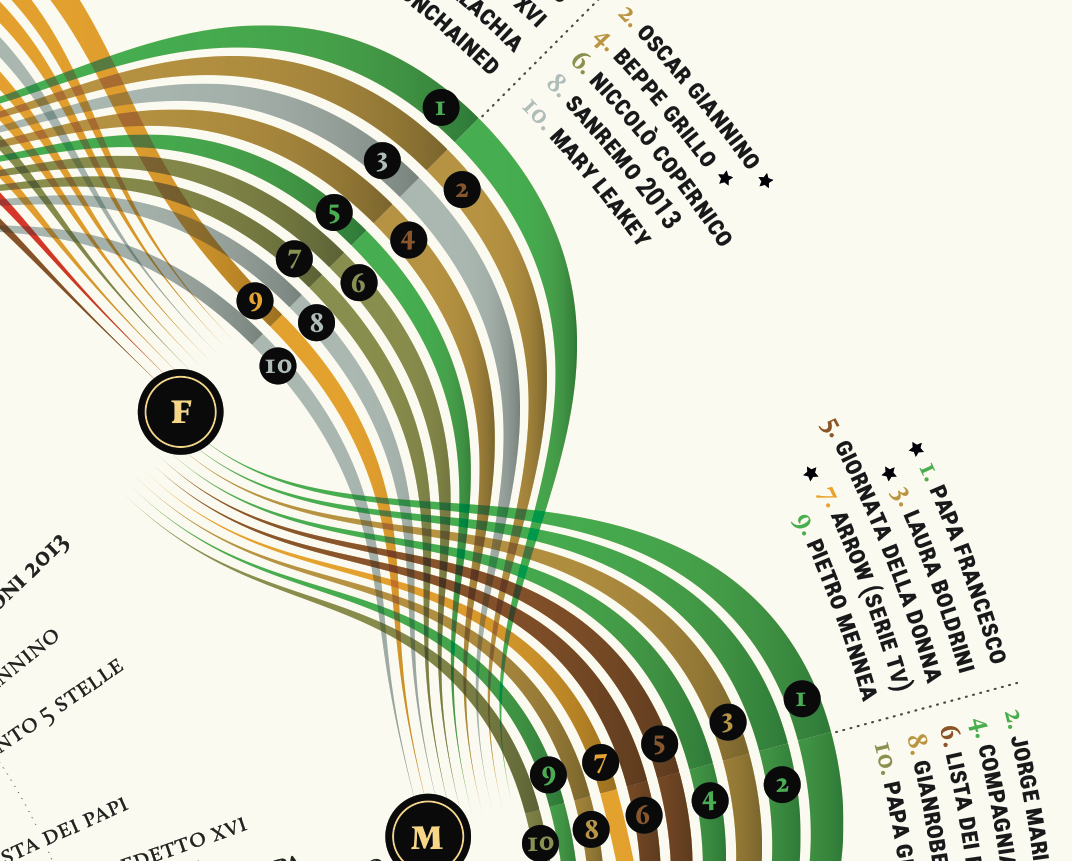
The visualization is divided into three layers: inside, the overall production on it.wiki in terms of edits; on the second level, the five pages with most editors and on the outer one, the most visited pages represented as flows.
The colours represent topic categories: cinema, politics, current events, sport, music and culture, miscellaneous, history.
What emerges from the Italian version of Wikipedia is a pattern of current events, tv series, famous deaths and –believe it or not- Google Doodles topics.
Whenever something happens, a particular book is quoted, a famous person dies (who we really don’t know anything about), we just google it, landing, in most of the cases, on a Wikipedia page.
Due to its popularity and to its policy that allows anyone to edit pages, Wikipedia often becomes a battlefield, where different factions try to impose their view on controversial topics (hopefully) trying to find a compromise.
All these activities generate a huge amount of data that the encyclopedia collects and makes available to everyone.
For the sake of its nature, it is possible to use Wikipedia as a device to look up the past: which were the most visited pages during 2013? Which were the most edited? What’s the overall picture of one year of history looked through Wikipedia?
For this visualization, we collected all the data on page views and edits on it.wikipedia.org in 2013.
Months are radially distributed (the letters refer to the Italian initials of each month: G= January, D=December).
The visualization is divided into three layers: inside, the overall production on it.wiki in terms of edits; on the second level, the five pages with most editors and on the outer one, the most visited pages represented as flows.
The colours represent topic categories: cinema, politics, current events, sport, music and culture, miscellaneous, history.
What emerges from the Italian version of Wikipedia is a pattern of current events, tv series, famous deaths and –believe it or not- Google Doodles topics.