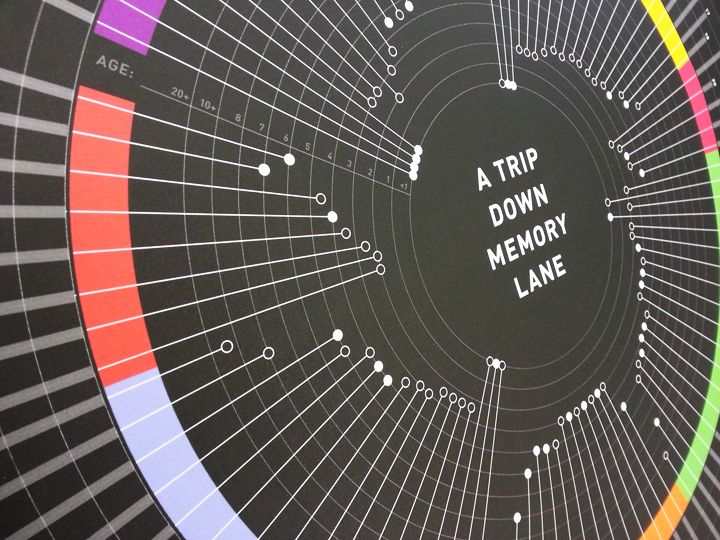
I took down the survey responses of 100 people and asked them what their earliest memory was. With this question, I organized my data into seven categories on a sense or factor the memory was based on to create a brief database of memories.
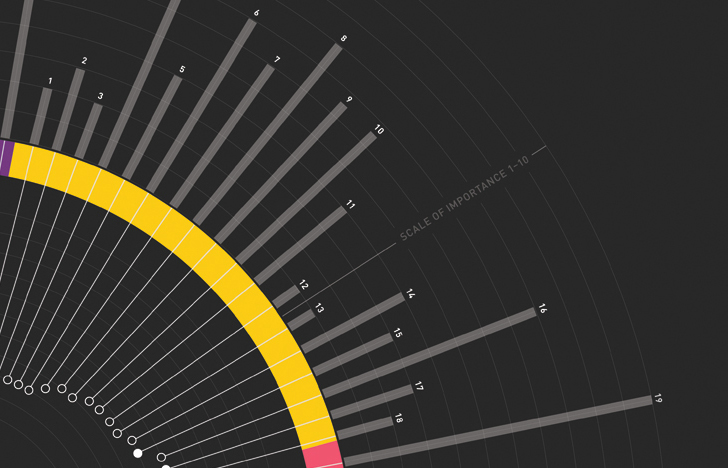
Starting from the center of the infograph, the filled and unfilled circles represent gender represented by the surveyers. These gender plots are placed on a ring of circles that represent the owners' ages in the memory. From here, they are assigned to a category by color and then enter into another set of rings that represent the scale of importance from 1–10 of the memory to the owner. At the end, a number can be found that can relay to the index of all 100 memories found at the bottom of the infographic.

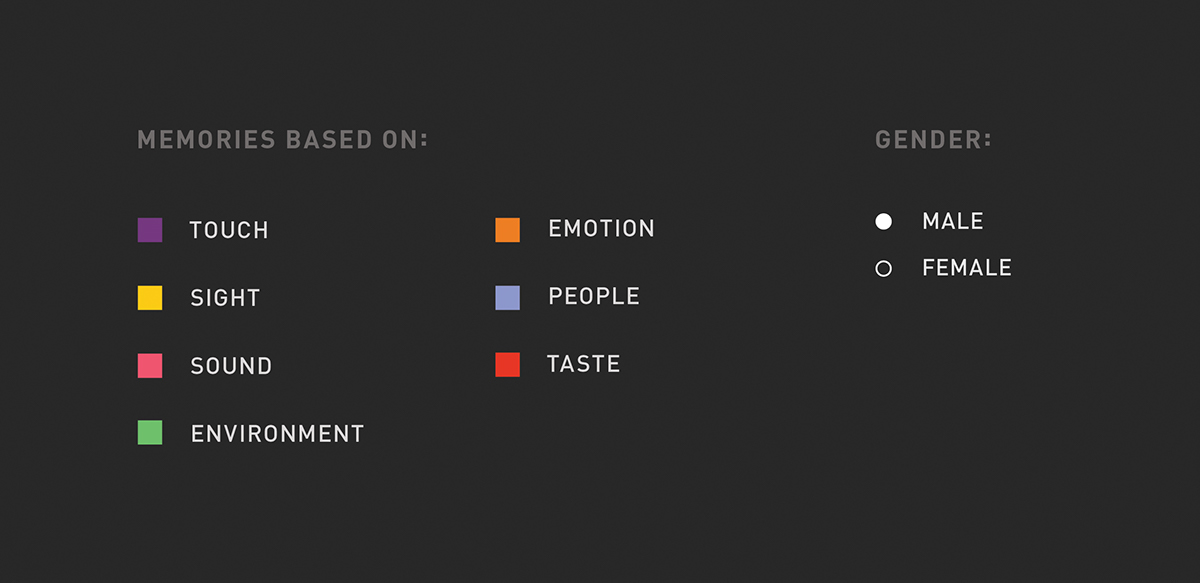
Close-up views of the infograph. Above is the key of the seven categories
of senses and factors that the memories were based on.
of senses and factors that the memories were based on.
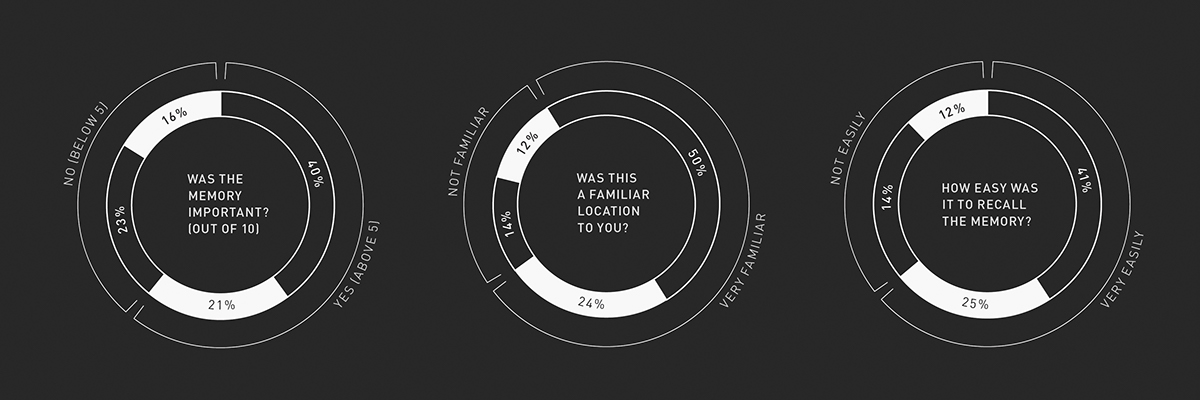
Below, the smaller graphs are summaries and findings of my data.

In addition to the infograph, I was also assigned to design an interactive app using the same data. For this project, I wanted to create a database where the user can visually see the data animate as well as read the data.
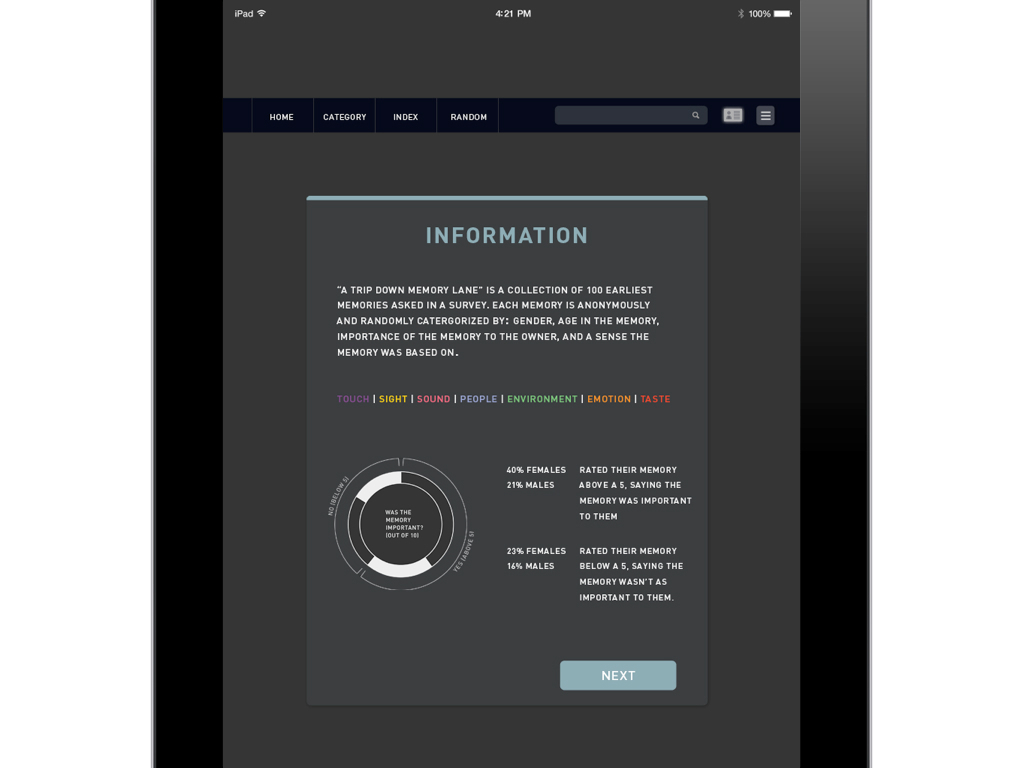
Presented with Keynote, I based my interactive project on a tablet where the user can navigate through with touch to experience different ways to view the database. For my app I made two nav bars that served different functions. The fixed navbar at the top is to display different ways to view the information. The second navbar in the top right functions for other options for the app.
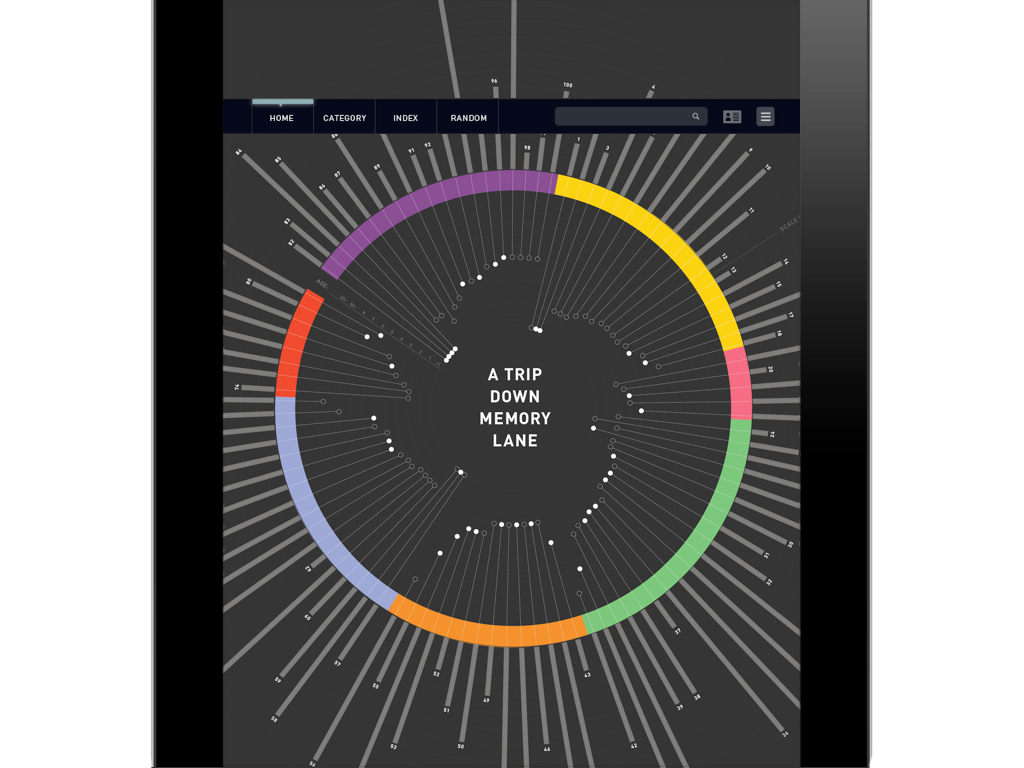
The HOME button can animate through a narrative that is told the same way as my printed infograph.
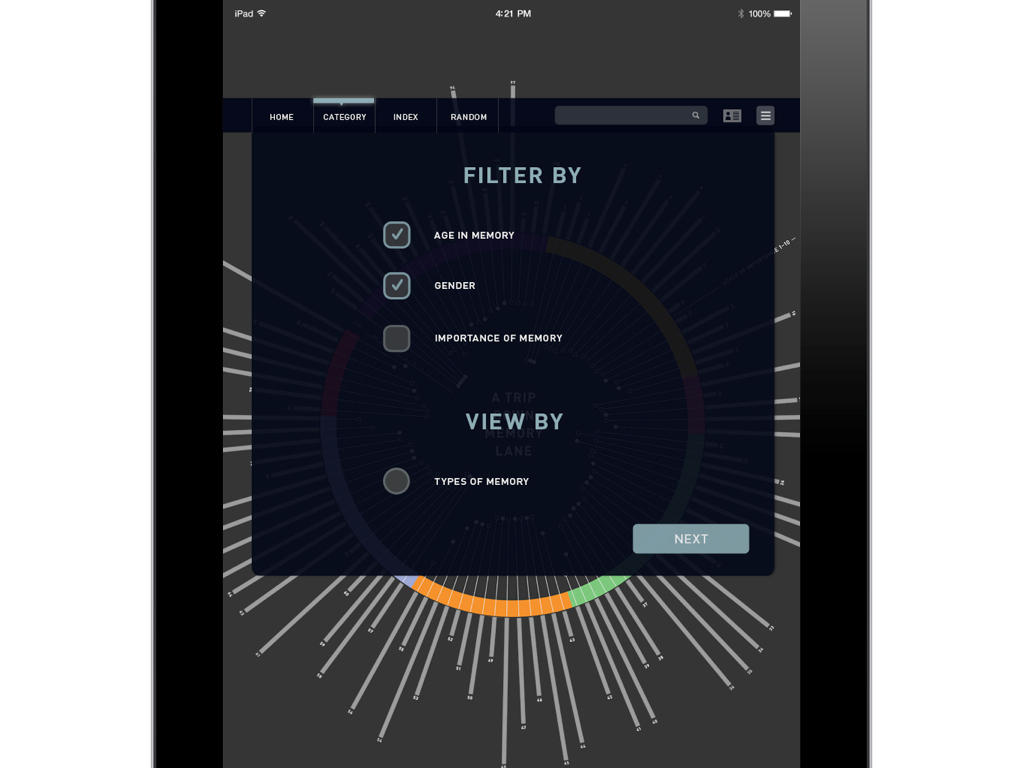
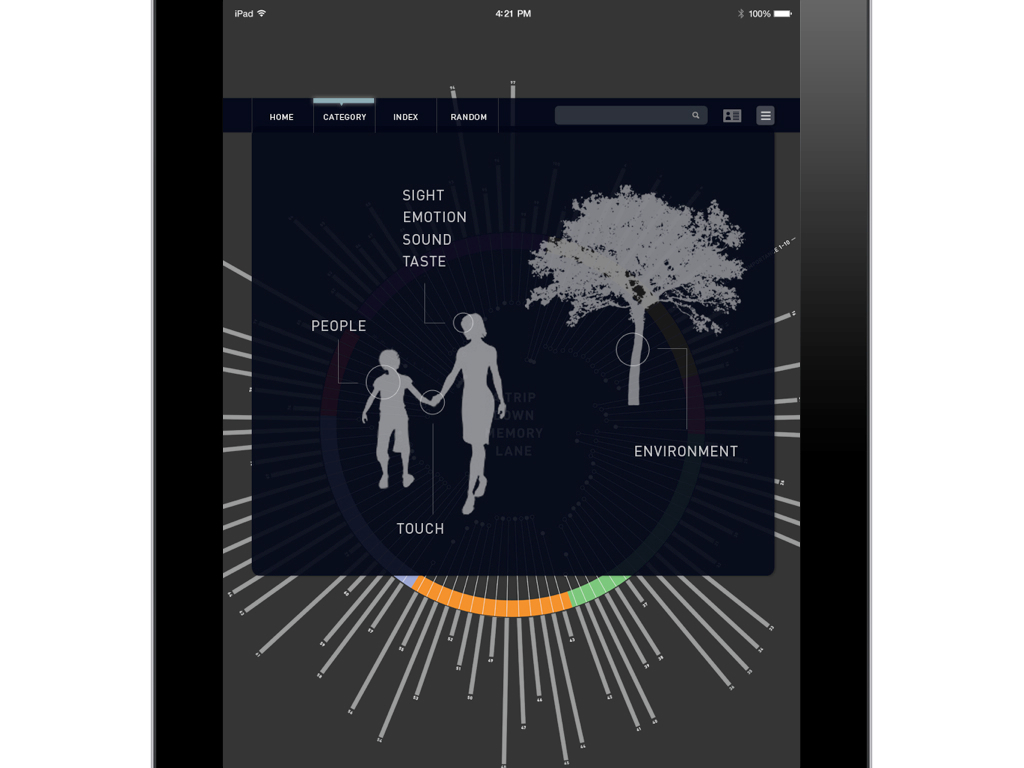
The CATEGORY button gives visual learners a way to view the information. A pull-down menu comes down to allow users to filter specific information this way as well.
The INDEX button caters to the another type of learner for those who wish to simply read all the data. The user can navigate the pages with the arrows or swipe through all 25 pages. They also have the option of assorting through the data as well.

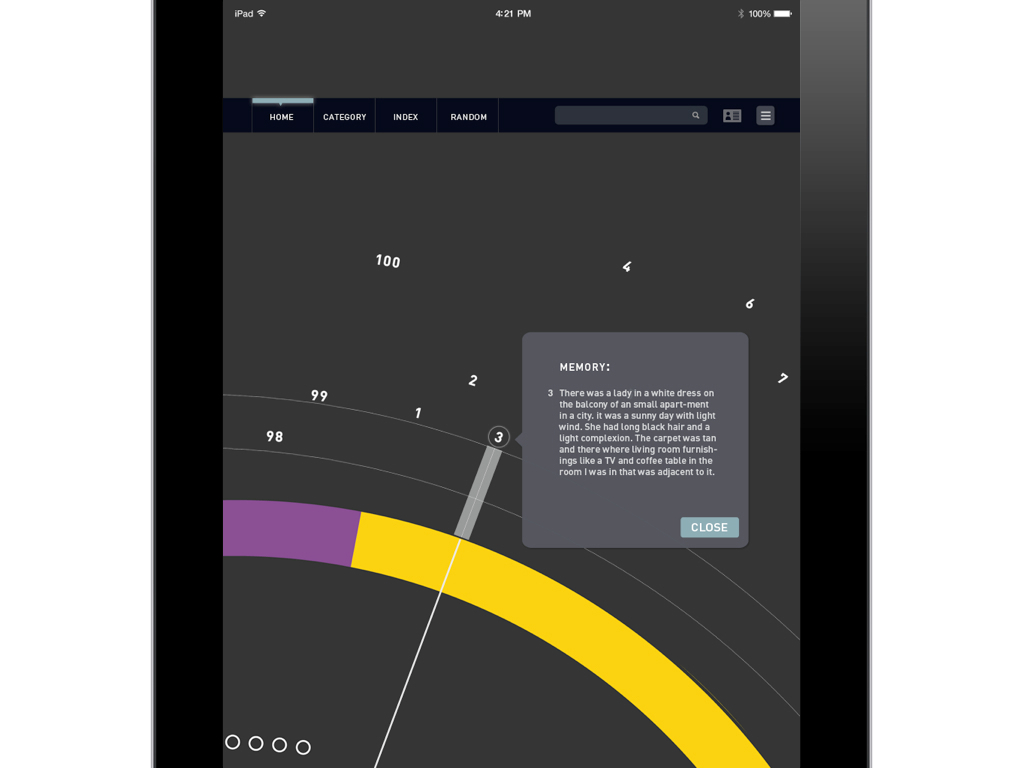
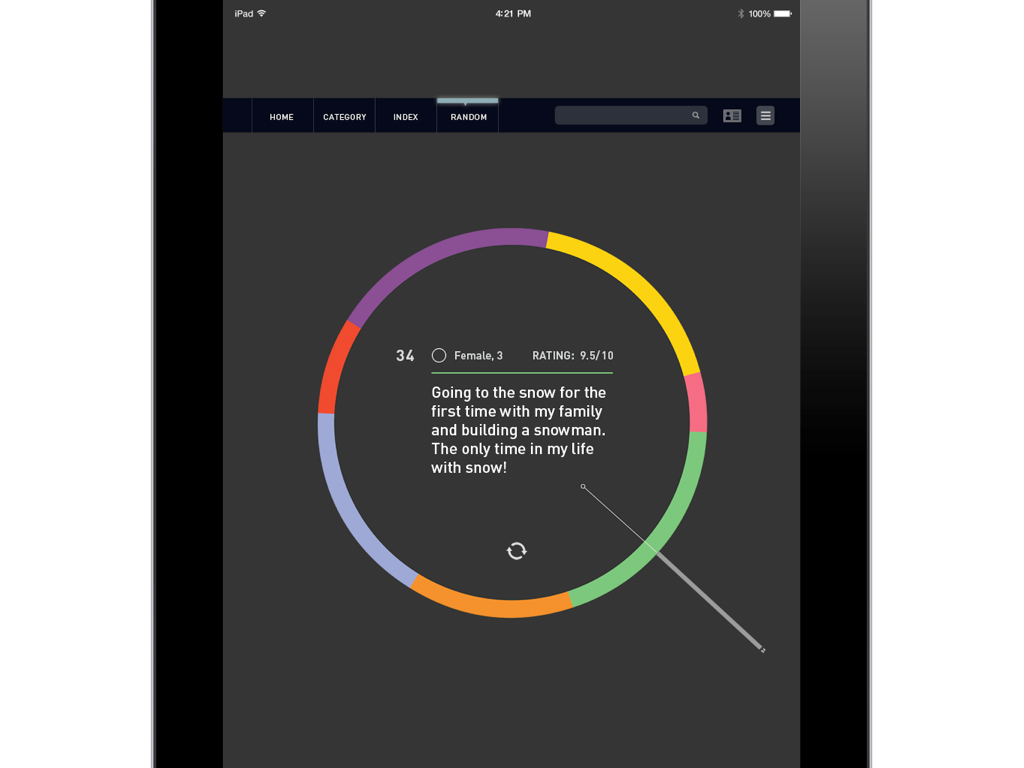
The RANDOM button gives a chance for the user to simply refresh the page to view different memories. The plotted data and the line connecting it is displayed at the exact spot shown on the original inforgraph.
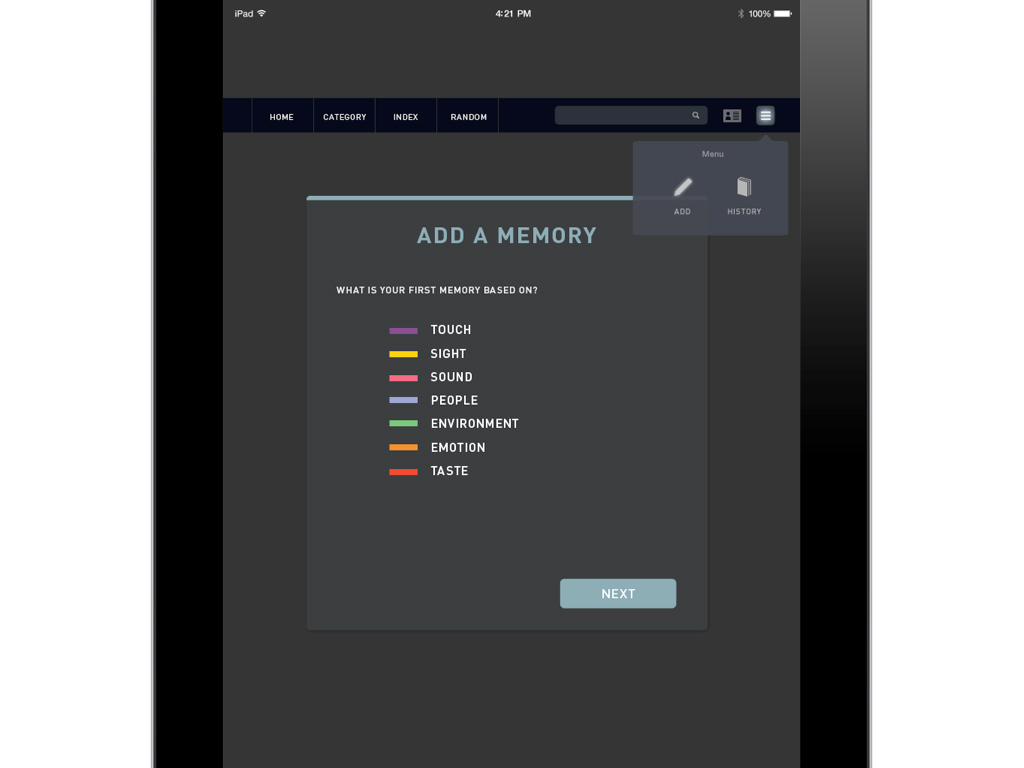
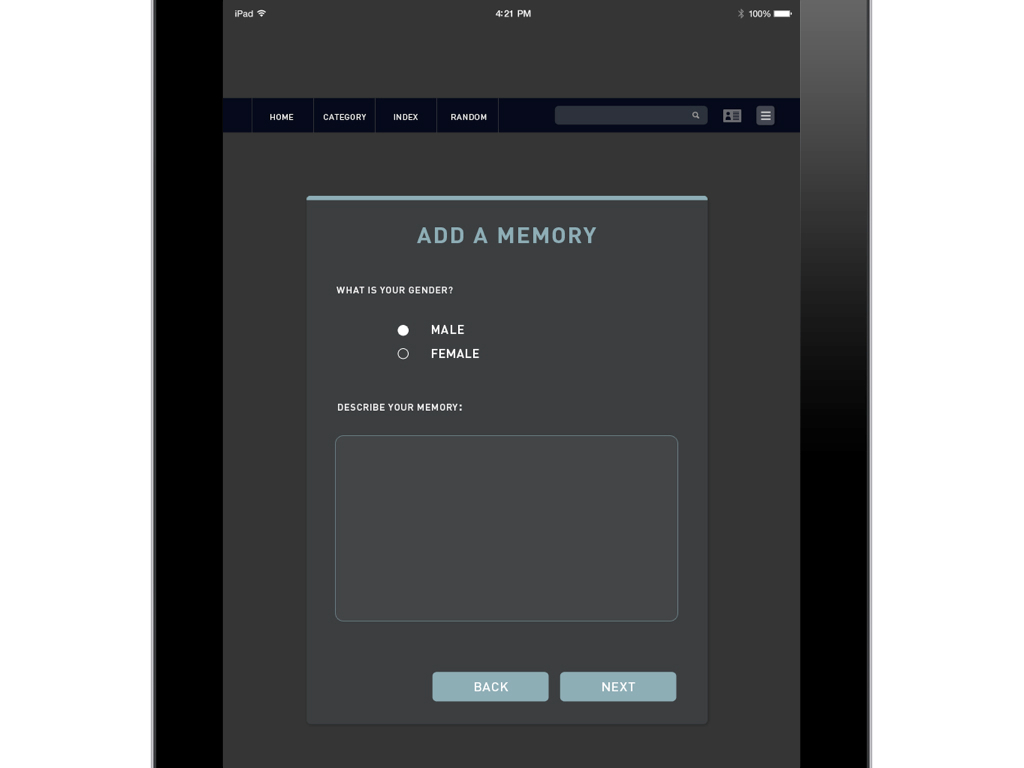
The second navbar is introduced here allow for more functions such as adding a memory or viewing the history. A history button would be implemented as more users can add their own memory, the app would refresh the graph to stay within 100 memories. The older memories would be kept in the history.
The information page has extra information should as a short summary of the purpose of the app, the key of the seven categories, and my findings.
An assignment for Brian Lucid's Information Architecture I class.
Student work for Massachusetts College of Art and Design.
Student work for Massachusetts College of Art and Design.


