


In the last few years, Hollywood was forced to confront its old problem of diversity, especially after the #OscarsSoWhite movement in 2015. This visualization examines gender, ethnicity, LGBTQ and people with disabilities on screen across 100 top-grossing films in the U.S in 2019.
More importantly, how does this inequality reflected in the most popular movie companies?
More importantly, how does this inequality reflected in the most popular movie companies?
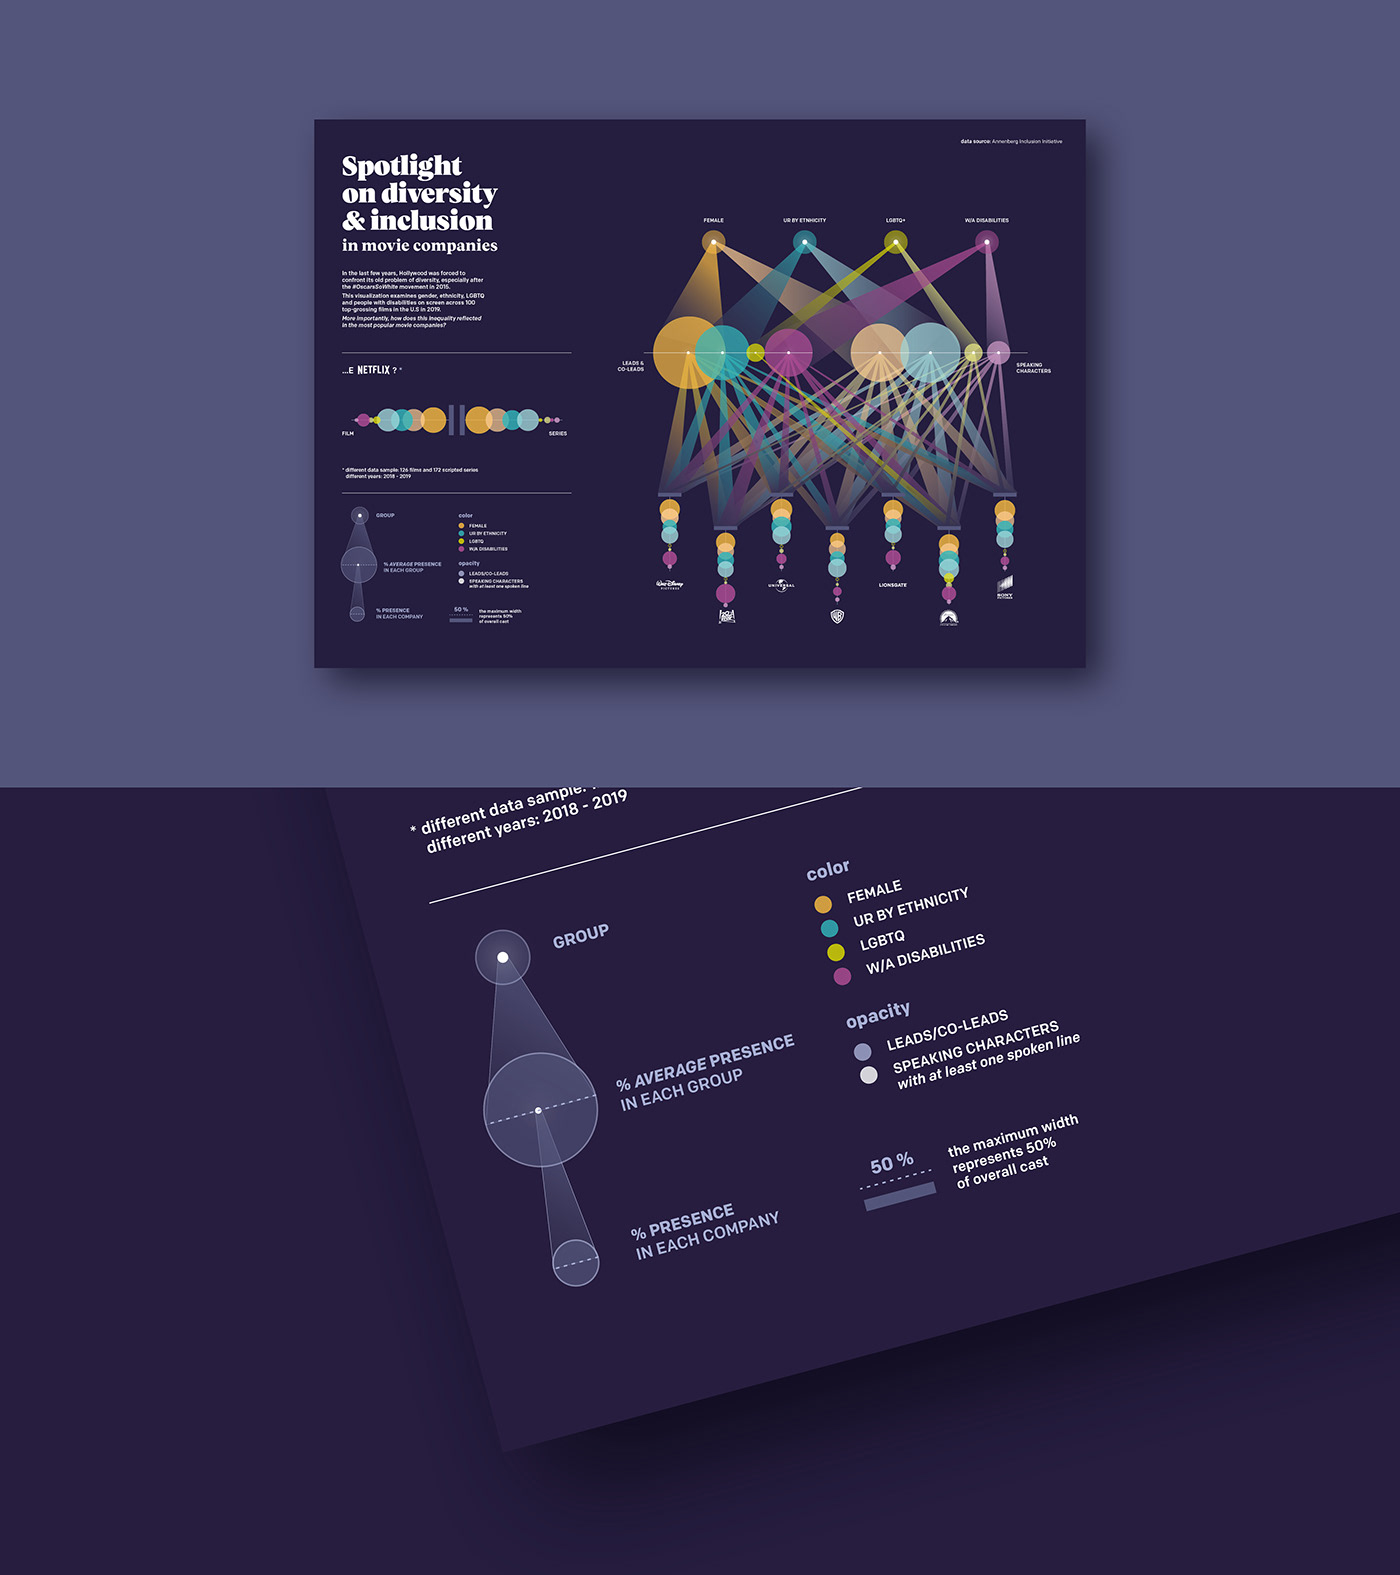

*Netflix has a different data sample: 126 films and 172 scripted series in 2018-2019


Data Source:
Inequality in 1300 films, USC Annenberg Inclusion Iniziative
Inequality in 1300 films, USC Annenberg Inclusion Iniziative
Inclusion in Netflix original U.S. scripted series & films, USC Annenberg Inclusion Iniziative
Hollywood diversity, UCLA College Sciences


